Estimated Value: $245,273 - $276,000
--
Bed
2
Baths
1,709
Sq Ft
$153/Sq Ft
Est. Value
About This Home
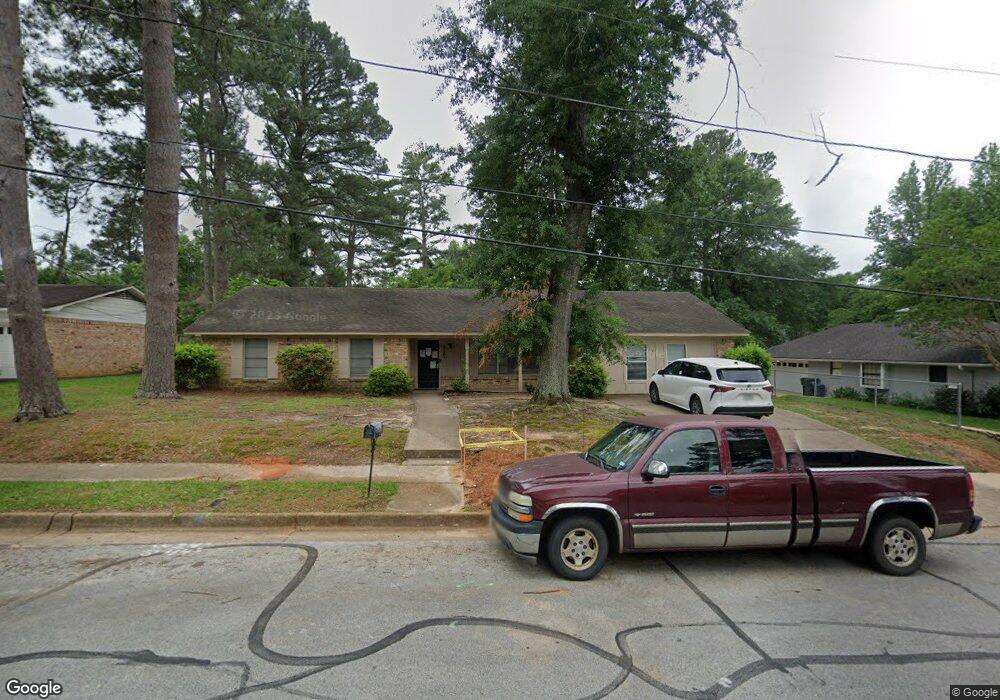
This home is located at 2727 Fairfax Dr, Tyler, TX 75701 and is currently estimated at $261,068, approximately $152 per square foot. 2727 Fairfax Dr is a home located in Smith County with nearby schools including Clarkston Elementary School, Hubbard Middle School, and Tyler Legacy High School.
Ownership History
Date
Name
Owned For
Owner Type
Purchase Details
Closed on
May 27, 2011
Sold by
Redman Richard R and Redman Laura L
Bought by
Redman Legacy Lp
Current Estimated Value
Create a Home Valuation Report for This Property
The Home Valuation Report is an in-depth analysis detailing your home's value as well as a comparison with similar homes in the area
Home Values in the Area
Average Home Value in this Area
Purchase History
| Date | Buyer | Sale Price | Title Company |
|---|---|---|---|
| Redman Legacy Lp | -- | None Available |
Source: Public Records
Tax History Compared to Growth
Tax History
| Year | Tax Paid | Tax Assessment Tax Assessment Total Assessment is a certain percentage of the fair market value that is determined by local assessors to be the total taxable value of land and additions on the property. | Land | Improvement |
|---|---|---|---|---|
| 2025 | $3,966 | $204,812 | $36,533 | $168,279 |
| 2024 | $3,966 | $233,113 | $29,340 | $203,773 |
| 2023 | $3,765 | $215,976 | $29,340 | $186,636 |
| 2022 | $3,828 | $195,382 | $29,340 | $166,042 |
| 2021 | $3,225 | $153,700 | $29,340 | $124,360 |
| 2020 | $3,429 | $160,245 | $29,340 | $130,905 |
| 2019 | $2,981 | $136,332 | $14,670 | $121,662 |
| 2018 | $2,848 | $130,963 | $14,670 | $116,293 |
| 2017 | $2,796 | $130,963 | $14,670 | $116,293 |
| 2016 | $2,818 | $132,011 | $14,670 | $117,341 |
| 2015 | $2,564 | $127,021 | $14,670 | $112,351 |
| 2014 | $2,564 | $120,645 | $14,670 | $105,975 |
Source: Public Records
Map
Nearby Homes
- 2827 Fairfax Dr
- 2716 Roanoke Ln
- 2631 Amy Ln
- 2902 Shenandoah Dr
- 2512 Alta Mira Dr
- 2509 Delmar Dr
- 2830 Juniper Ln
- 3109 Campus Cir
- 2523 Shenandoah Dr
- 1920 McDonald Rd
- 3108 Williamsburg Cir
- 2909 Meadowlark Ln
- 2226 Mimosa Dr
- 2716 Royal Village Way
- 3020 Meadowlark Ln
- The Dawson Plan at New Home Living at Medina
- 2949 Medina Dr
- The Hubbard Plan at New Home Living at Medina
- 3801 Old Troup Hwy
- 2936 Rollingwood Dr
- 2801 2801 Fairfax
- 2801 Fairfax Dr
- 2721 Fairfax Dr
- 2726 Rockbridge Rd
- 2734 Rockbridge Rd
- 2726 2726 Rockbridge Rd
- 2809 Fairfax Dr
- 2720 Rockbridge Rd
- 2726 Fairfax Dr
- 2720 2720 Rockbridge
- 2806 Rockbridge Dr
- 2806 2806 Rockbridge Dr
- 2720 Fairfax Dr
- 2715 2715 Fairfax Dr
- 2800 Fairfax Dr
- 2714 2714 Fairfax Dr
- 2714 Rockbridge Rd
- 2815 Fairfax Dr
- 2714 2714 Rockbridge Rd
- 2815 2815 Fairfax Dr