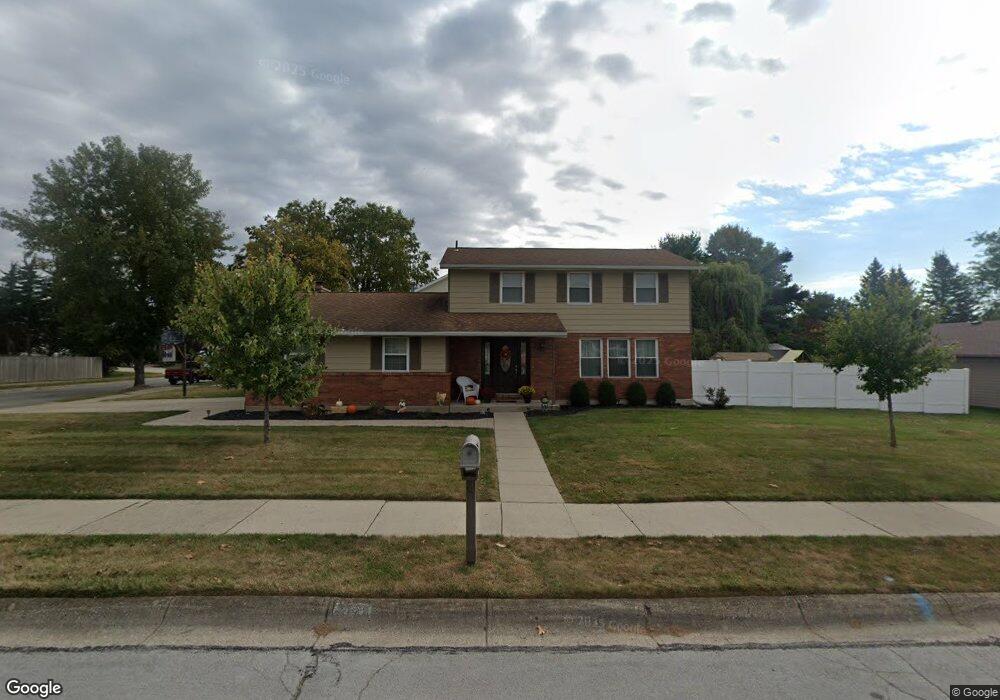
2728 Conestoga St Springfield, OH 45503
Estimated Value: $275,353 - $342,000
3
Beds
3
Baths
1,870
Sq Ft
$162/Sq Ft
Est. Value
About This Home
This home is located at 2728 Conestoga St, Springfield, OH 45503 and is currently estimated at $302,838, approximately $161 per square foot. 2728 Conestoga St is a home located in Clark County with nearby schools including Northridge Elementary School, Kenton Ridge Middle & High School, and Emmanuel Christian Academy.
Ownership History
Date
Name
Owned For
Owner Type
Purchase Details
Closed on
May 5, 2016
Sold by
Catanzaro Francis P and Catanzaro Cynthia A
Bought by
Walters Kevin P and Walters Stacey M
Current Estimated Value
Home Financials for this Owner
Home Financials are based on the most recent Mortgage that was taken out on this home.
Original Mortgage
$80,000
Outstanding Balance
$63,273
Interest Rate
3.71%
Mortgage Type
New Conventional
Estimated Equity
$239,565
Purchase Details
Closed on
Jul 20, 2015
Sold by
Claar Michael S
Bought by
Catanzaro Francis P and Catanzaro Cynthia A
Purchase Details
Closed on
Nov 13, 1998
Sold by
Mader David R and Mader Rosalind
Bought by
Claar Michael S and Nicewaner Beth A
Home Financials for this Owner
Home Financials are based on the most recent Mortgage that was taken out on this home.
Original Mortgage
$117,800
Interest Rate
6.68%
Mortgage Type
Purchase Money Mortgage
Purchase Details
Closed on
May 27, 1986
Create a Home Valuation Report for This Property
The Home Valuation Report is an in-depth analysis detailing your home's value as well as a comparison with similar homes in the area
Home Values in the Area
Average Home Value in this Area
Purchase History
| Date | Buyer | Sale Price | Title Company |
|---|---|---|---|
| Walters Kevin P | $166,000 | Ohio Real Estate Title | |
| Catanzaro Francis P | $86,000 | Attorney | |
| Claar Michael S | $124,000 | -- | |
| -- | $84,000 | -- |
Source: Public Records
Mortgage History
| Date | Status | Borrower | Loan Amount |
|---|---|---|---|
| Open | Walters Kevin P | $80,000 | |
| Previous Owner | Claar Michael S | $117,800 |
Source: Public Records
Tax History
| Year | Tax Paid | Tax Assessment Tax Assessment Total Assessment is a certain percentage of the fair market value that is determined by local assessors to be the total taxable value of land and additions on the property. | Land | Improvement |
|---|---|---|---|---|
| 2025 | $2,507 | $84,320 | $14,110 | $70,210 |
| 2024 | $2,423 | $59,120 | $13,890 | $45,230 |
| 2023 | $2,423 | $59,120 | $13,890 | $45,230 |
| 2022 | $2,432 | $59,120 | $13,890 | $45,230 |
| 2021 | $2,574 | $53,690 | $11,200 | $42,490 |
| 2020 | $2,577 | $53,690 | $11,200 | $42,490 |
| 2019 | $2,629 | $53,690 | $11,200 | $42,490 |
| 2018 | $2,604 | $51,330 | $8,900 | $42,430 |
| 2017 | $2,215 | $46,585 | $8,904 | $37,681 |
| 2016 | $2,255 | $46,585 | $8,904 | $37,681 |
| 2015 | $1,046 | $46,081 | $8,400 | $37,681 |
| 2014 | $5,676 | $46,081 | $8,400 | $37,681 |
| 2013 | $2,139 | $46,081 | $8,400 | $37,681 |
Source: Public Records
Map
Nearby Homes
- 2043 Providence Ave
- 2861 Ashlar Dr
- 3214 Revels St
- 2529 Marinette Dr
- 3300 Revels St
- 2332 Villa Rd
- 2022 Westboro Ave
- 1924 Marinette Dr
- 2400 Thor Dr
- 1948 Falmouth Ave
- 1811 Devon Dr
- 3126 Lakeview Ct Unit 3126
- 1516 Hyannis Dr
- 1711 Pinehurst Dr
- 1831 Pinehurst Dr Unit 37
- 1507 Kingsgate Rd
- 1628 Yorkshire Ct
- 1040 Carson Ln
- 1505 Kingsgate Rd
- 1032 Armsgate Rd
- 2107 Kittyhawk Ave
- 2726 Conestoga St
- 2731 Conestoga St
- 2740 Conestoga St
- 2727 Conestoga St
- 2735 Conestoga St
- 2100 Conowoods Dr
- 2108 Conowoods Dr
- 2112 Kittyhawk Ave
- 2076 Conowoods Dr
- 2739 Conestoga St
- 2115 Kittyhawk Ave
- 2744 Conestoga St
- 2116 Conowoods Dr
- 2741 Old Oak Ln
- 2730 Seymour Ln
- 2743 Conestoga St
- 2728 Seymour Ln
- 2734 Seymour Ln
- 2729 Vada Ln
Your Personal Tour Guide
Ask me questions while you tour the home.