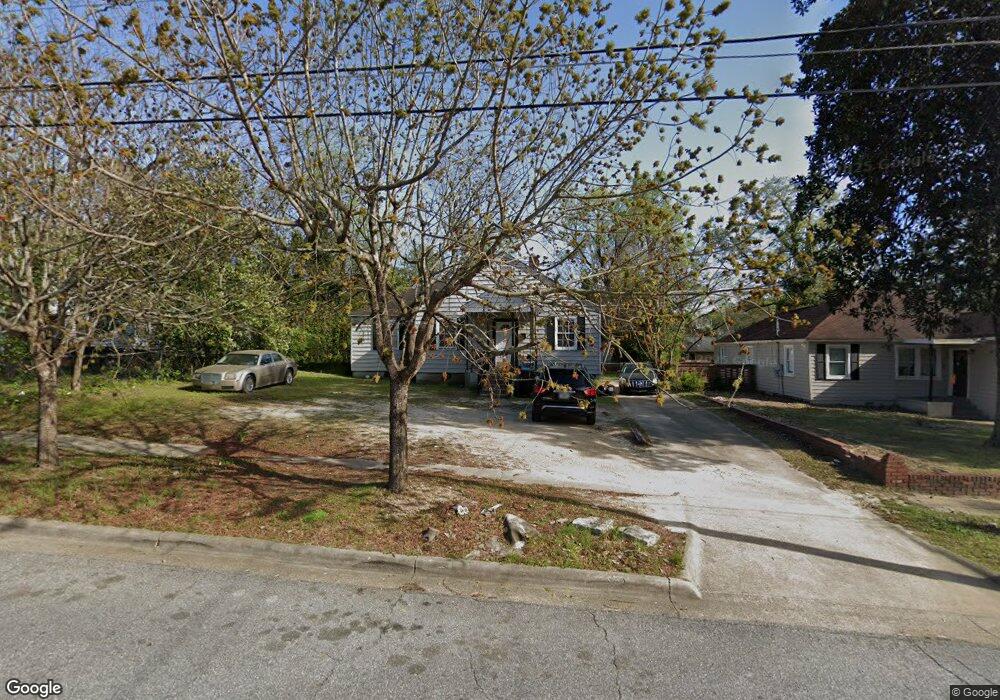
2728 Fern St Columbus, GA 31906
Briarwood NeighborhoodEstimated Value: $62,545 - $109,000
3
Beds
3
Baths
1,246
Sq Ft
$68/Sq Ft
Est. Value
About This Home
This home is located at 2728 Fern St, Columbus, GA 31906 and is currently estimated at $84,136, approximately $67 per square foot. 2728 Fern St is a home located in Muscogee County with nearby schools including Rigdon Road Elementary School, Rothschild Leadership Academy, and Carver High School.
Ownership History
Date
Name
Owned For
Owner Type
Purchase Details
Closed on
Apr 25, 2017
Bought by
River City Investors Llc
Current Estimated Value
Home Financials for this Owner
Home Financials are based on the most recent Mortgage that was taken out on this home.
Original Mortgage
$140,000
Outstanding Balance
$26,195
Interest Rate
4.14%
Mortgage Type
New Conventional
Estimated Equity
$57,941
Purchase Details
Closed on
Feb 7, 2017
Sold by
Nobes Patricia
Bought by
First Peoples Bank
Purchase Details
Closed on
Jan 22, 2013
Sold by
Jer Property Investments L
Bought by
Nobes Patricia
Home Financials for this Owner
Home Financials are based on the most recent Mortgage that was taken out on this home.
Original Mortgage
$43,510
Interest Rate
3.38%
Mortgage Type
New Conventional
Purchase Details
Closed on
Nov 18, 2011
Sold by
Colony Bank
Bought by
Jer Property Investments Llc
Purchase Details
Closed on
Sep 6, 2011
Sold by
Hughes Steven Matthew
Bought by
Colony Bank
Create a Home Valuation Report for This Property
The Home Valuation Report is an in-depth analysis detailing your home's value as well as a comparison with similar homes in the area
Home Values in the Area
Average Home Value in this Area
Purchase History
| Date | Buyer | Sale Price | Title Company |
|---|---|---|---|
| River City Investors Llc | $110,000 | -- | |
| First Peoples Bank | $25,000 | -- | |
| Nobes Patricia | -- | -- | |
| Jer Property Investments Llc | $11,500 | -- | |
| Colony Bank | -- | -- |
Source: Public Records
Mortgage History
| Date | Status | Borrower | Loan Amount |
|---|---|---|---|
| Open | River City Investors Llc | $140,000 | |
| Previous Owner | Nobes Patricia | $43,510 |
Source: Public Records
Tax History Compared to Growth
Tax History
| Year | Tax Paid | Tax Assessment Tax Assessment Total Assessment is a certain percentage of the fair market value that is determined by local assessors to be the total taxable value of land and additions on the property. | Land | Improvement |
|---|---|---|---|---|
| 2025 | $3,562 | $19,660 | $4,080 | $15,580 |
| 2024 | $332 | $19,660 | $4,080 | $15,580 |
| 2023 | $774 | $19,660 | $4,080 | $15,580 |
| 2022 | $618 | $15,132 | $4,080 | $11,052 |
| 2021 | $651 | $14,164 | $4,080 | $10,084 |
| 2020 | $495 | $12,132 | $4,080 | $8,052 |
| 2019 | $497 | $12,132 | $4,080 | $8,052 |
| 2018 | $497 | $12,132 | $4,080 | $8,052 |
| 2017 | $860 | $20,928 | $5,100 | $15,828 |
| 2016 | $825 | $20,007 | $2,380 | $17,627 |
| 2015 | $331 | $20,007 | $2,380 | $17,627 |
| 2014 | $331 | $20,007 | $2,380 | $17,627 |
| 2013 | -- | $28,498 | $2,380 | $26,118 |
Source: Public Records
Map
Nearby Homes
- 2726 Marion St
- 1310 S Dixon Dr
- 1164 Tate Dr
- 2533 15th St
- 1319 Hilton Ave
- 1513 Wells Dr
- 1301 Rigdon Rd
- 1054 Lawyers Ln
- 2916 Gardenia St
- 2911 Gardenia St
- 1500 Preston Dr
- 2429 Bell St
- 2902 Hood St
- 2717 10th St
- 2312 Marion St
- 2400 Bell St
- 1047 Fisk Ave
- 1227 Forest Ave Unit 4
- 1630 Hilton Ave
- 3122 Glenwood Dr