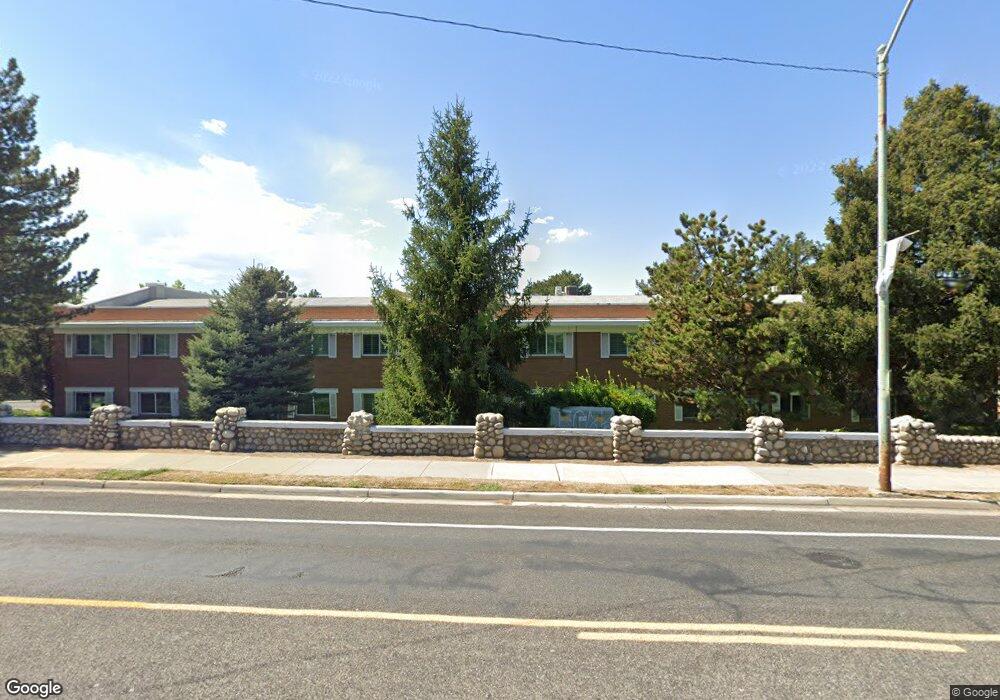
2728 Highland Dr Unit 9 Salt Lake City, UT 84106
Sugar House NeighborhoodEstimated Value: $345,000 - $443,000
1
Bed
3
Baths
1,277
Sq Ft
$298/Sq Ft
Est. Value
About This Home
This home is located at 2728 Highland Dr Unit 9, Salt Lake City, UT 84106 and is currently estimated at $380,667, approximately $298 per square foot. 2728 Highland Dr Unit 9 is a home located in Salt Lake County with nearby schools including Nibley Park School, Highland High School, and Wasatch Charter School.
Ownership History
Date
Name
Owned For
Owner Type
Purchase Details
Closed on
Nov 30, 2017
Sold by
Loiselle Iris J
Bought by
King Beverly C
Current Estimated Value
Home Financials for this Owner
Home Financials are based on the most recent Mortgage that was taken out on this home.
Original Mortgage
$100,000
Outstanding Balance
$84,038
Interest Rate
3.87%
Mortgage Type
Adjustable Rate Mortgage/ARM
Estimated Equity
$296,629
Purchase Details
Closed on
Nov 25, 2017
Sold by
Loiselle Iris J
Bought by
The Iris J Loiselle Family Trust
Home Financials for this Owner
Home Financials are based on the most recent Mortgage that was taken out on this home.
Original Mortgage
$100,000
Outstanding Balance
$84,038
Interest Rate
3.87%
Mortgage Type
Adjustable Rate Mortgage/ARM
Estimated Equity
$296,629
Purchase Details
Closed on
Nov 1, 2017
Sold by
Loiselle Iris J
Bought by
Loiselle Iris J
Home Financials for this Owner
Home Financials are based on the most recent Mortgage that was taken out on this home.
Original Mortgage
$100,000
Outstanding Balance
$84,038
Interest Rate
3.87%
Mortgage Type
Adjustable Rate Mortgage/ARM
Estimated Equity
$296,629
Purchase Details
Closed on
Apr 25, 2016
Sold by
Loiselle Iris J
Bought by
Loiselle Iris J and Iris J Loiselle Family Trust
Purchase Details
Closed on
Jul 14, 2008
Sold by
Johnson Robin B and Johnson David K
Bought by
Loiselle Iris J
Purchase Details
Closed on
Aug 18, 2007
Sold by
Johnson Ladonna
Bought by
Brooks Lloyd D and Brooks Adrian S
Purchase Details
Closed on
Oct 6, 2006
Sold by
Hunter Tana Peery and Peery Teri
Bought by
Johnson Ladonna
Purchase Details
Closed on
Oct 16, 2002
Sold by
Hunter Tana Peery
Bought by
Peery Joseph S
Home Financials for this Owner
Home Financials are based on the most recent Mortgage that was taken out on this home.
Original Mortgage
$70,700
Interest Rate
4.87%
Purchase Details
Closed on
Oct 14, 2002
Sold by
Peery Teri
Bought by
Peery Joseph S
Home Financials for this Owner
Home Financials are based on the most recent Mortgage that was taken out on this home.
Original Mortgage
$70,700
Interest Rate
4.87%
Purchase Details
Closed on
Oct 11, 2002
Sold by
Peery Joseph S
Bought by
Peery Joseph S and Hunter Tana Peery
Home Financials for this Owner
Home Financials are based on the most recent Mortgage that was taken out on this home.
Original Mortgage
$70,700
Interest Rate
4.87%
Purchase Details
Closed on
Dec 10, 1996
Sold by
Lopez Jose V
Bought by
Lopez Jose and Lopez Jami Bean
Purchase Details
Closed on
Jan 3, 1996
Sold by
Peterson Scott D and Peterson Vauna Lee
Bought by
Peterson Scott D and Peterson Vauna Lee
Purchase Details
Closed on
Nov 16, 1995
Sold by
Peery Joseph S
Bought by
Peery Joseph S and Hunter Tana Peery
Create a Home Valuation Report for This Property
The Home Valuation Report is an in-depth analysis detailing your home's value as well as a comparison with similar homes in the area
Home Values in the Area
Average Home Value in this Area
Purchase History
| Date | Buyer | Sale Price | Title Company |
|---|---|---|---|
| King Beverly C | -- | Integrated Title Ins Service | |
| The Iris J Loiselle Family Trust | -- | None Available | |
| Loiselle Iris J | -- | None Available | |
| Loiselle Iris J | -- | Richland Title Ins Agency In | |
| Loiselle Iris J | -- | Paramount Title | |
| Brooks Lloyd D | -- | None Available | |
| Johnson Ladonna | -- | Paramount Title | |
| Peery Joseph S | -- | Landmark Title | |
| Peery Joseph S | -- | Landmark Title | |
| Peery Joseph S | -- | Landmark Title | |
| Lopez Jose | -- | -- | |
| Peterson Scott D | -- | -- | |
| Peery Joseph S | -- | -- |
Source: Public Records
Mortgage History
| Date | Status | Borrower | Loan Amount |
|---|---|---|---|
| Open | King Beverly C | $100,000 | |
| Previous Owner | Peery Joseph S | $70,700 |
Source: Public Records
Tax History Compared to Growth
Tax History
| Year | Tax Paid | Tax Assessment Tax Assessment Total Assessment is a certain percentage of the fair market value that is determined by local assessors to be the total taxable value of land and additions on the property. | Land | Improvement |
|---|---|---|---|---|
| 2025 | $1,800 | $328,400 | $98,500 | $229,900 |
| 2024 | $1,800 | $343,400 | $103,000 | $240,400 |
| 2023 | $1,784 | $328,100 | $98,400 | $229,700 |
| 2022 | $1,877 | $323,800 | $97,100 | $226,700 |
| 2021 | $1,604 | $250,600 | $75,200 | $175,400 |
| 2020 | $1,590 | $236,400 | $70,900 | $165,500 |
| 2019 | $1,628 | $227,700 | $68,300 | $159,400 |
| 2018 | $1,520 | $207,100 | $62,100 | $145,000 |
| 2017 | $195 | $159,700 | $47,900 | $111,800 |
| 2016 | $1 | $144,100 | $43,200 | $100,900 |
| 2015 | $1,194 | $137,200 | $41,100 | $96,100 |
| 2014 | -- | $135,800 | $40,700 | $95,100 |
Source: Public Records
Map
Nearby Homes
- 2710 S Highland Dr Unit 11
- 1190 E 2700 S Unit A4
- 1190 E 2700 S Unit A1
- 1192 E 2700 S
- 2760 S Highland Dr Unit 21
- 1130 E 2700 S Unit K83
- 1150 E 2700 S Unit 50G
- 1150 E 2700 S Unit G51
- 1152 E 2700 S Unit S148
- 2618 S 1100 E
- 1314 E Crandall Ave
- 2865 S 1335 E
- 2430 S Elizabeth St Unit 5
- 2438 S Elizabeth St Unit 2
- 2477 S Douglas St
- 1168 E Parkway Ave
- 1371 E Zenith Ave
- 2970 S Richmond St
- 2400 S Elizabeth St Unit 4
- 916 E Forest View Ave
- 2728 Highland Dr Unit 5
- 2728 Highland Dr Unit 8
- 2728 Highland Dr Unit 12
- 2728 Highland Dr Unit 11
- 2728 Highland Dr Unit 2
- 2728 Highland Dr Unit 7
- 2728 Highland Dr Unit 1
- 2728 Highland Dr Unit 3
- 2728 Highland Dr Unit 10
- 2728 Highland Dr Unit 6
- 2728 Highland Dr Unit 4
- 2718 S Highland Dr
- 2718 S Highland Dr Unit I
- 2718 S Highland Dr Unit 5
- 2718 S Highland Dr Unit 3
- 2718 S Highland Dr Unit 9
- 2718 S Highland Dr Unit 5
- 2718 S Highland Dr Unit 1
- 2718 S Highland Dr Unit 2
- 2718 S Highland Dr Unit 1