Estimated Value: $493,000 - $517,000
4
Beds
2
Baths
2,373
Sq Ft
$213/Sq Ft
Est. Value
About This Home
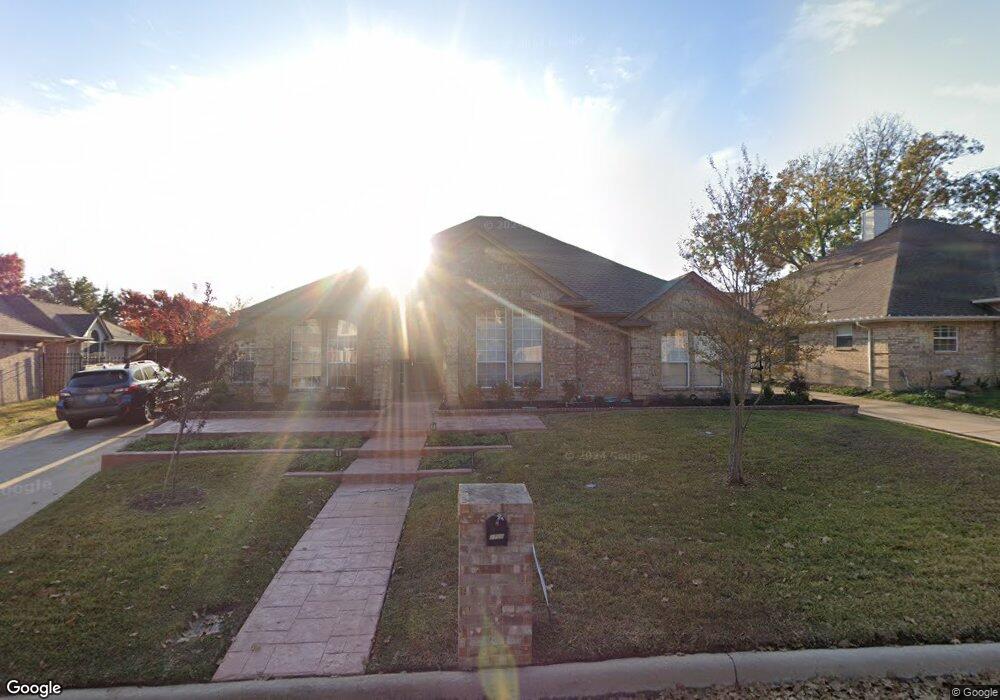
This home is located at 2728 Montreal Dr, Hurst, TX 76054 and is currently estimated at $506,508, approximately $213 per square foot. 2728 Montreal Dr is a home located in Tarrant County with nearby schools including Bransford Elementary School, Colleyville Middle School, and Grapevine High School.
Ownership History
Date
Name
Owned For
Owner Type
Purchase Details
Closed on
Jul 29, 2005
Sold by
Guardian Homes Inc
Bought by
Ryan Christian S
Current Estimated Value
Home Financials for this Owner
Home Financials are based on the most recent Mortgage that was taken out on this home.
Original Mortgage
$152,400
Outstanding Balance
$79,285
Interest Rate
5.51%
Mortgage Type
Fannie Mae Freddie Mac
Estimated Equity
$427,223
Purchase Details
Closed on
May 3, 2005
Sold by
Benoy Christopher M
Bought by
Guardian Homes Inc
Purchase Details
Closed on
Aug 25, 1995
Sold by
Texas Best Custom Homes Inc
Bought by
Benoy Christopher M
Home Financials for this Owner
Home Financials are based on the most recent Mortgage that was taken out on this home.
Original Mortgage
$140,000
Interest Rate
7.76%
Purchase Details
Closed on
Apr 26, 1995
Sold by
Norwood National Corp
Bought by
Texas Best Custom Homes Inc
Create a Home Valuation Report for This Property
The Home Valuation Report is an in-depth analysis detailing your home's value as well as a comparison with similar homes in the area
Home Values in the Area
Average Home Value in this Area
Purchase History
| Date | Buyer | Sale Price | Title Company |
|---|---|---|---|
| Ryan Christian S | -- | Stewart Title | |
| Guardian Homes Inc | $138,500 | -- | |
| Benoy Christopher M | -- | Safeco Land Title Co | |
| Texas Best Custom Homes Inc | -- | Safeco Land Title |
Source: Public Records
Mortgage History
| Date | Status | Borrower | Loan Amount |
|---|---|---|---|
| Open | Ryan Christian S | $152,400 | |
| Previous Owner | Benoy Christopher M | $140,000 |
Source: Public Records
Tax History Compared to Growth
Tax History
| Year | Tax Paid | Tax Assessment Tax Assessment Total Assessment is a certain percentage of the fair market value that is determined by local assessors to be the total taxable value of land and additions on the property. | Land | Improvement |
|---|---|---|---|---|
| 2025 | $3,987 | $509,017 | $85,000 | $424,017 |
| 2024 | $3,987 | $509,017 | $85,000 | $424,017 |
| 2023 | $8,266 | $451,414 | $85,000 | $366,414 |
| 2022 | $8,700 | $374,432 | $55,000 | $319,432 |
| 2021 | $8,976 | $376,009 | $55,000 | $321,009 |
| 2020 | $8,146 | $324,197 | $55,000 | $269,197 |
| 2019 | $8,387 | $326,176 | $55,000 | $271,176 |
| 2018 | $3,214 | $303,643 | $55,000 | $248,643 |
| 2017 | $7,337 | $306,595 | $55,000 | $251,595 |
| 2016 | $6,670 | $264,969 | $40,000 | $224,969 |
| 2015 | $5,482 | $232,200 | $25,000 | $207,200 |
| 2014 | $5,482 | $232,200 | $25,000 | $207,200 |
Source: Public Records
Map
Nearby Homes
- 4600 Bransford Rd
- 312 Bremen Dr
- 405 Bremen Dr
- 114 Glade Rd
- 112 Glade Rd
- 2732 Woodbridge Dr
- 1921 Maplewood Trail
- 3713 Brentwood Ct
- 628 Huntwich Dr
- 2844 Hurstview Dr
- 405 Woodbriar Ct
- 3208 Glade Pointe Ct
- 2116 Cottage Oak Ln
- 4105 Inwood Ln
- 3132 Hurstview Dr
- 2620 Brookridge Dr
- 5104 Shadowood Rd
- 2809 Sandstone Dr
- 4600 Westbury Dr
- 909 Brestol Ct W
- 2724 Montreal Dr
- 2732 Montreal Dr
- 2720 Montreal Dr
- 2729 Montreal Dr
- 2733 Montreal Dr
- 2736 Montreal Dr
- 2725 Montreal Dr
- 2716 Montreal Dr
- 2737 Montreal Dr
- 2740 Montreal Dr
- 2721 Montreal Dr
- 105 Heneretta Dr
- 103 Heneretta Dr
- 2712 Montreal Dr
- 2744 Montreal Dr
- 107 Heneretta Dr
- 2716 Mill Haven Dr
- 2720 Mill Haven Dr
- 97 Bremen Dr
- 2800 Mill Ridge Dr