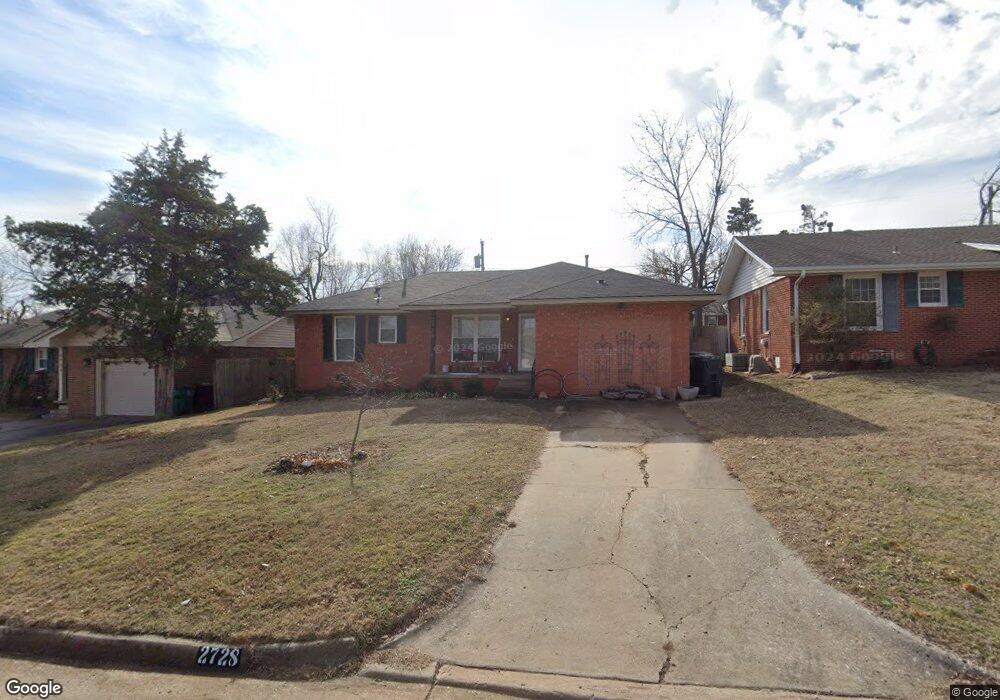
2728 NW 67th St Oklahoma City, OK 73116
Estimated Value: $195,000 - $210,000
4
Beds
2
Baths
1,004
Sq Ft
$200/Sq Ft
Est. Value
About This Home
This home is located at 2728 NW 67th St, Oklahoma City, OK 73116 and is currently estimated at $201,296, approximately $200 per square foot. 2728 NW 67th St is a home located in Oklahoma County with nearby schools including Nichols Hills Elementary School, John Marshall Middle School, and John Marshall High School.
Ownership History
Date
Name
Owned For
Owner Type
Purchase Details
Closed on
Aug 20, 2012
Sold by
Ohanlan Lisa L
Bought by
Ohanlan Brandon L
Current Estimated Value
Purchase Details
Closed on
Oct 29, 2010
Sold by
Hollister Rossana and Ugarte Federico De La Torre
Bought by
Ohanlan Brandon
Home Financials for this Owner
Home Financials are based on the most recent Mortgage that was taken out on this home.
Original Mortgage
$106,071
Outstanding Balance
$70,340
Interest Rate
4.37%
Mortgage Type
FHA
Estimated Equity
$130,956
Purchase Details
Closed on
Jul 27, 2000
Sold by
Feighny James and Feighny Amy
Bought by
Hollister Rossana
Purchase Details
Closed on
Jul 25, 2000
Sold by
Warren William H and Warren Linda
Bought by
Feighny James and Feighny Amy
Purchase Details
Closed on
Jul 6, 1998
Sold by
Brown Jeff and Brown Jeffrey Jennings
Bought by
Warren William H
Create a Home Valuation Report for This Property
The Home Valuation Report is an in-depth analysis detailing your home's value as well as a comparison with similar homes in the area
Home Values in the Area
Average Home Value in this Area
Purchase History
| Date | Buyer | Sale Price | Title Company |
|---|---|---|---|
| Ohanlan Brandon L | -- | O S Title | |
| Ohanlan Brandon | $107,500 | The Oklahoma City Abstract & | |
| Hollister Rossana | $68,000 | Stewart Abstract & Title | |
| Feighny James | -- | Stewart Abstract & Title | |
| Warren William H | $46,500 | -- |
Source: Public Records
Mortgage History
| Date | Status | Borrower | Loan Amount |
|---|---|---|---|
| Open | Ohanlan Brandon | $106,071 |
Source: Public Records
Tax History Compared to Growth
Tax History
| Year | Tax Paid | Tax Assessment Tax Assessment Total Assessment is a certain percentage of the fair market value that is determined by local assessors to be the total taxable value of land and additions on the property. | Land | Improvement |
|---|---|---|---|---|
| 2024 | $2,129 | $18,203 | $2,782 | $15,421 |
| 2023 | $2,129 | $17,337 | $2,578 | $14,759 |
| 2022 | $1,942 | $16,511 | $2,796 | $13,715 |
| 2021 | $1,851 | $15,725 | $2,820 | $12,905 |
| 2020 | $1,783 | $14,977 | $3,010 | $11,967 |
| 2019 | $1,697 | $14,264 | $2,213 | $12,051 |
| 2018 | $1,541 | $13,585 | $0 | $0 |
| 2017 | $1,524 | $13,449 | $2,230 | $11,219 |
| 2016 | $1,453 | $12,809 | $2,150 | $10,659 |
| 2015 | $1,397 | $12,199 | $2,360 | $9,839 |
| 2014 | $1,388 | $12,190 | $2,360 | $9,830 |
Source: Public Records
Map
Nearby Homes
- 2712 NW 69th St
- 2837 NW 66th St
- 2752 Lancaster Ln
- 6709 N Country Club Dr
- 6815 N Country Club Dr
- 2532 Lancaster Ln
- 2527 NW 62nd St Unit 214
- 2525 NW 62nd St Unit 103
- 2525 NW 62nd St Unit 206
- 2529 NW 62nd St Unit 227
- 2832 Warwick Dr
- 2926 NW 72nd St
- 2516 NW 62nd St Unit 2516 and 2518
- 6162 N Brookline Ave Unit 13
- 3105 Hickory Sign Post Rd Unit 34B
- 3109 Hickory Sign Post Rd Unit 33B
- 3113 Hickory Sign Post Rd Unit 32
- 3107 NW 63rd St Unit 40
- 3119 Spring Willow Rd
- 6428 Brandywine Ln
- 2732 NW 67th St
- 2724 NW 67th St
- 2736 NW 67th St
- 2725 NW 66th St
- 2720 NW 67th St
- 2729 NW 66th St
- 2721 NW 66th St
- 2733 NW 66th St
- 2729 NW 67th St
- 2716 NW 67th St
- 2733 NW 67th St
- 2800 NW 67th St
- 2725 NW 67th St
- 2717 NW 66th St
- 2737 NW 66th St
- 2737 NW 67th St
- 2721 NW 67th St
- 2712 NW 67th St
- 2801 NW 66th St
- 2801 NW 67th St