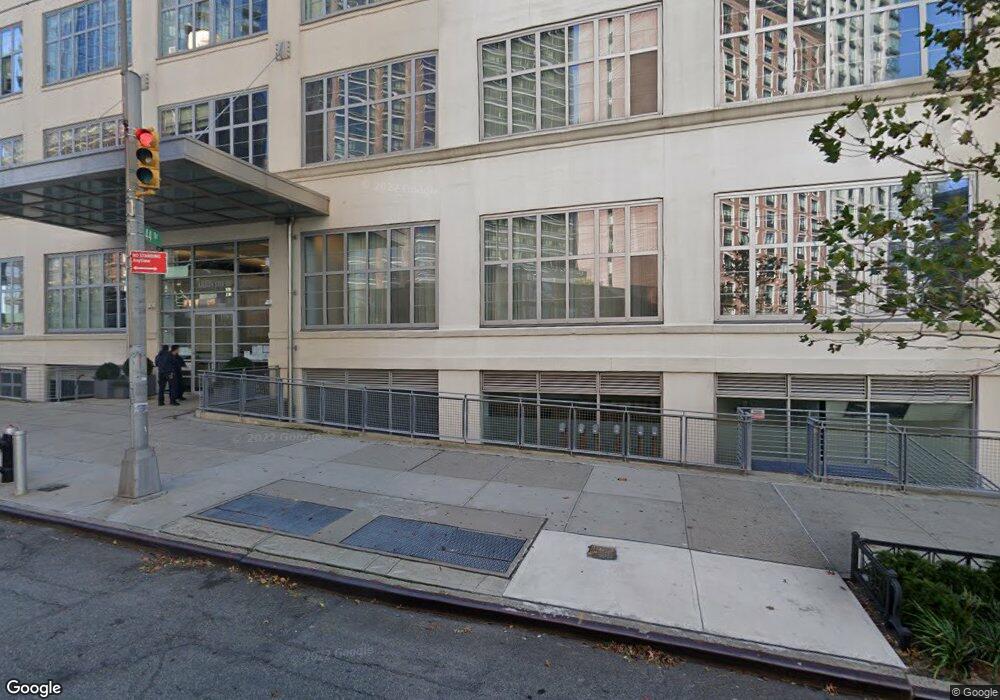
Arris Lofts 2728 Thomson Ave Unit 804 Long Island City, NY 11101
Long Island City NeighborhoodEstimated Value: $1,196,169 - $1,701,000
--
Bed
--
Bath
1,338
Sq Ft
$1,108/Sq Ft
Est. Value
About This Home
This home is located at 2728 Thomson Ave Unit 804, Long Island City, NY 11101 and is currently estimated at $1,482,056, approximately $1,107 per square foot. 2728 Thomson Ave Unit 804 is a home located in Queens County with nearby schools including P.S./I.S. 78Q Early Childhood Center, I.S. 204 Oliver W. Holmes, and Long Island City High School.
Ownership History
Date
Name
Owned For
Owner Type
Purchase Details
Closed on
Jun 4, 2022
Sold by
Kwon Ryan
Bought by
Kwon Ryan and Nguyen Tricia
Current Estimated Value
Home Financials for this Owner
Home Financials are based on the most recent Mortgage that was taken out on this home.
Original Mortgage
$12,651
Outstanding Balance
$12,035
Interest Rate
5.25%
Mortgage Type
Purchase Money Mortgage
Estimated Equity
$1,470,021
Purchase Details
Closed on
Nov 12, 2015
Sold by
Kucerova Katerina and Roeser Andrew T
Bought by
Kwon Ryan
Home Financials for this Owner
Home Financials are based on the most recent Mortgage that was taken out on this home.
Original Mortgage
$1,182,400
Outstanding Balance
$932,534
Interest Rate
3.87%
Estimated Equity
$549,522
Purchase Details
Closed on
Oct 14, 2009
Sold by
Tag Court Square Llc
Bought by
Kucerova Katerina and Roeser Andrew T
Home Financials for this Owner
Home Financials are based on the most recent Mortgage that was taken out on this home.
Original Mortgage
$555,000
Interest Rate
5.09%
Mortgage Type
Purchase Money Mortgage
Create a Home Valuation Report for This Property
The Home Valuation Report is an in-depth analysis detailing your home's value as well as a comparison with similar homes in the area
Home Values in the Area
Average Home Value in this Area
Purchase History
| Date | Buyer | Sale Price | Title Company |
|---|---|---|---|
| Kwon Ryan | -- | -- | |
| Kwon Ryan | $1,478,000 | -- | |
| Kucerova Katerina | $775,000 | -- |
Source: Public Records
Mortgage History
| Date | Status | Borrower | Loan Amount |
|---|---|---|---|
| Open | Kwon Ryan | $12,651 | |
| Open | Kwon Ryan | $1,182,400 | |
| Previous Owner | Kucerova Katerina | $555,000 |
Source: Public Records
Tax History Compared to Growth
Tax History
| Year | Tax Paid | Tax Assessment Tax Assessment Total Assessment is a certain percentage of the fair market value that is determined by local assessors to be the total taxable value of land and additions on the property. | Land | Improvement |
|---|---|---|---|---|
| 2025 | $9,706 | $79,712 | $4,299 | $75,413 |
| 2024 | $6,748 | $77,635 | $4,299 | $73,336 |
| 2023 | $9,455 | $75,628 | $4,299 | $71,329 |
| 2022 | $4,489 | $79,615 | $4,299 | $75,316 |
| 2021 | $3,909 | $68,424 | $4,299 | $64,125 |
| 2020 | $2,620 | $75,786 | $4,299 | $71,487 |
| 2019 | $658 | $72,959 | $4,299 | $68,660 |
| 2018 | $547 | $61,610 | $4,299 | $57,311 |
| 2017 | $547 | $58,235 | $4,298 | $53,937 |
| 2016 | $554 | $58,235 | $4,298 | $53,937 |
| 2015 | -- | $53,101 | $4,604 | $48,497 |
| 2014 | -- | $52,223 | $4,622 | $47,601 |
Source: Public Records
About Arris Lofts
Map
Nearby Homes
- 27-28 Thomson Ave Unit 243
- 27-28 Thomson Ave Unit 304
- 27-21 44th Dr Unit 1601
- 4507 Court Square Unit 8D
- 4507 Court Square Unit 6G
- 44-27 Purves St Unit 9F
- 44-27 Purves St Unit 8-D
- 44-27 Purves St Unit 15D
- 5 Court Square Unit 8-D
- 5 Court Square Unit 10-D
- 5 Court Square Unit 6-G
- 5 Court Square Unit 9-D
- 5 Court Square Unit 6A
- 4415 Purves St Unit 14D
- 44-15 Purves St Unit 5-D
- 44-15 Purves St Unit 15-C
- 45-30 Pearson St Unit 18E
- 45-30 Pearson St Unit PH-3C
- 45-30 Pearson St Unit PH-3A
- 45-30 Pearson St Unit 4-G
- 2728 Thomson Ave
- 2728 Thomson Ave Unit 304
- 2728 Thomson Ave Unit 246
- 2728 Thomson Ave Unit 710
- 2728 Thomson Ave Unit 708
- 2728 Thomson Ave Unit 604
- 2728 Thomson Ave Unit 551
- 2728 Thomson Ave Unit 546
- 2728 Thomson Ave Unit 535
- 2728 Thomson Ave Unit 533
- 2728 Thomson Ave Unit 530
- 2728 Thomson Ave Unit 523
- 2728 Thomson Ave Unit 514
- 2728 Thomson Ave Unit 452
- 2728 Thomson Ave Unit 444
- 2728 Thomson Ave Unit 416
- 2728 Thomson Ave Unit 338
- 2728 Thomson Ave Unit 337
- 2728 Thomson Ave Unit 333
- 2728 Thomson Ave Unit 323