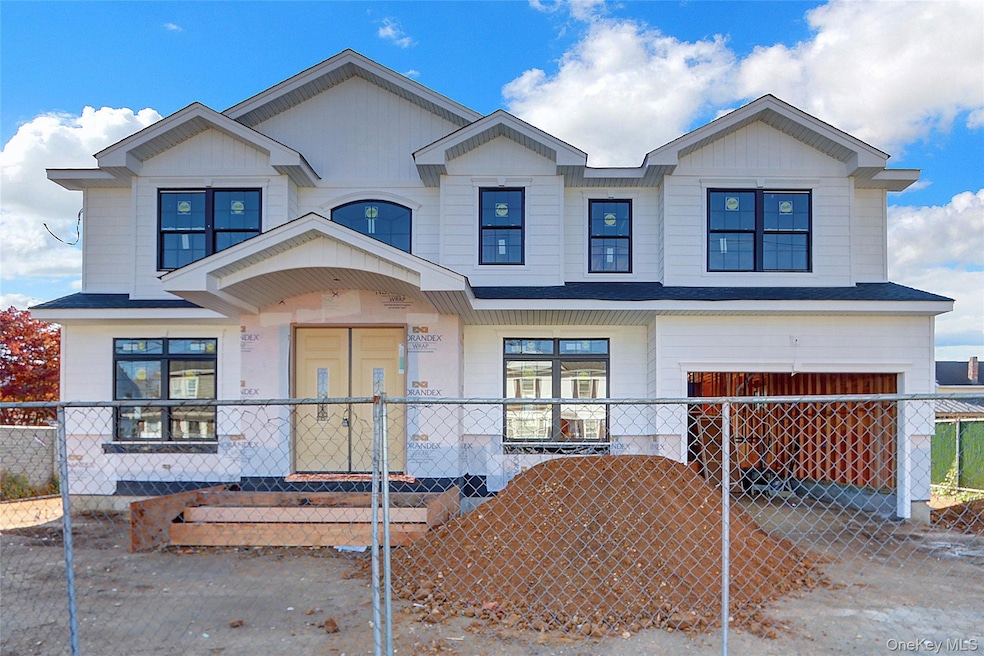


2728 Wilson Ave Bellmore, NY 11710
Estimated payment $8,900/month
Highlights
- Colonial Architecture
- Main Floor Bedroom
- Formal Dining Room
- Winthrop Avenue School Rated A
- 1 Fireplace
- 1 Car Attached Garage
About This Home
Welcome to this stunning new construction offering 5 spacious bedrooms, 3 full baths, and nearly 3,200 sq ft of luxury living. Designed with comfort and efficiency in mind, this home features central air, whole-home air purification system, Natural gas, and Energy Star appliances throughout. Enjoy an open-concept layout, high-end finishes with a modern kitchen with premium cabinetry, stone countertops, and quality appliances and a full basement for added space and storage. Built to the highest standards with modern design and premium craftsmanship—this is the perfect blend of style, function, and sustainability. Don’t miss your chance to own a brand-new home in the sought-after Bellmore town! The interior pictures are from another property from the same builder so the interior on this will be very similar.
Listing Agent
360 Realty Group Brokerage Phone: 631-987-7362 License #10401290938 Listed on: 10/07/2025
Co-Listing Agent
360 Realty Group Brokerage Phone: 631-987-7362 License #10401288223
Home Details
Home Type
- Single Family
Est. Annual Taxes
- $13,769
Year Built
- Built in 2026
Parking
- 1 Car Attached Garage
- Driveway
Home Design
- Colonial Architecture
- Frame Construction
Interior Spaces
- 3,175 Sq Ft Home
- 1 Fireplace
- Formal Dining Room
- Basement Fills Entire Space Under The House
- Dryer
Kitchen
- Eat-In Kitchen
- Oven
- Range
- Microwave
- Dishwasher
- ENERGY STAR Qualified Appliances
Bedrooms and Bathrooms
- 5 Bedrooms
- Main Floor Bedroom
- 3 Full Bathrooms
Schools
- Winthrop Avenue Elementary School
- Grand Avenue Middle School
- John F Kennedy High School
Utilities
- Central Air
- Heating System Uses Natural Gas
- Natural Gas Connected
Additional Features
- Air Purifier
- 6,750 Sq Ft Lot
Listing and Financial Details
- Assessor Parcel Number 2089-56-339-00-0011-0
Map
Home Values in the Area
Average Home Value in this Area
Tax History
| Year | Tax Paid | Tax Assessment Tax Assessment Total Assessment is a certain percentage of the fair market value that is determined by local assessors to be the total taxable value of land and additions on the property. | Land | Improvement |
|---|---|---|---|---|
| 2025 | $13,769 | $446 | $185 | $261 |
| 2024 | $3,466 | $446 | $185 | $261 |
| 2023 | $13,105 | $472 | $198 | $274 |
| 2022 | $13,105 | $446 | $185 | $261 |
| 2021 | $16,127 | $458 | $190 | $268 |
| 2020 | $12,080 | $593 | $554 | $39 |
| 2019 | $11,034 | $631 | $590 | $41 |
| 2018 | $11,056 | $631 | $0 | $0 |
| 2017 | $6,853 | $631 | $469 | $162 |
| 2016 | $9,762 | $631 | $469 | $162 |
| 2015 | $3,389 | $793 | $590 | $203 |
| 2014 | $3,389 | $793 | $590 | $203 |
| 2013 | $3,855 | $793 | $590 | $203 |
Property History
| Date | Event | Price | List to Sale | Price per Sq Ft |
|---|---|---|---|---|
| 02/20/2026 02/20/26 | Pending | -- | -- | -- |
| 01/19/2026 01/19/26 | Price Changed | $1,473,888 | -1.0% | $464 / Sq Ft |
| 11/12/2025 11/12/25 | For Sale | $1,488,888 | 0.0% | $469 / Sq Ft |
| 11/06/2025 11/06/25 | Off Market | $1,488,888 | -- | -- |
| 10/07/2025 10/07/25 | For Sale | $1,488,888 | -- | $469 / Sq Ft |
Purchase History
| Date | Type | Sale Price | Title Company |
|---|---|---|---|
| Bargain Sale Deed | $587,000 | Westcor Land Title Ins Co | |
| Interfamily Deed Transfer | -- | Chicago Title Insurance Co | |
| Interfamily Deed Transfer | -- | Chicago Title Insurance Co | |
| Interfamily Deed Transfer | -- | Chicago Title Insurance Co | |
| Interfamily Deed Transfer | -- | Your Title Experts | |
| Interfamily Deed Transfer | -- | Your Title Experts | |
| Interfamily Deed Transfer | -- | Your Title Experts | |
| Interfamily Deed Transfer | -- | Your Title Experts | |
| Bargain Sale Deed | $140,000 | -- | |
| Bargain Sale Deed | $140,000 | -- | |
| Bargain Sale Deed | $140,000 | -- |
Source: OneKey® MLS
MLS Number: 922035
APN: 2089-56-339-00-0011-0
Disclaimer: Certain information contained herein is derived from information provided by parties other than Homes.com. All information provided is deemed reliable, but is not guaranteed to be accurate and should be independently verified.
![]() The data relating to real estate for sale or lease on this web site comes in part from OneKey® MLS. Real estate listings held by brokerage firms other than Ten-X are marked with the OneKey® MLS logo or an abbreviated logo and detailed information about them includes the name of the listing broker.
The data relating to real estate for sale or lease on this web site comes in part from OneKey® MLS. Real estate listings held by brokerage firms other than Ten-X are marked with the OneKey® MLS logo or an abbreviated logo and detailed information about them includes the name of the listing broker.
Based on information submitted to the MLS GRID. All data is obtained from various sources and may not have been verified by broker or MLS GRID. Supplied Open House Information is subject to change without notice. All information should be independently reviewed and verified for accuracy. Properties may or may not be listed by the office/agent presenting the information. Some IDX listings have been excluded from this website. IDX information is provided exclusively for personal, non-commercial use, and may not be used for any purpose other than to identify prospective properties consumers may be interested in purchasing.
Information is deemed reliable but not guaranteed.
Copyright 2026 OneKey® MLS. All rights reserved.
Based on information submitted to the MLS GRID
- 2768 Wilson Ave
- 534 Bedford Ave Unit A2
- 2657 Wilson Ave
- 2864 Wilson Ave
- No # Clarendon Ave
- 2780 Natta Blvd
- 2066 Lakeview Rd Unit A
- 402 Marle Place
- 1972 Russell St
- 2550 Natta Blvd
- 3031 Lowell Ave
- 3042 Lowell Ave
- 1781 Cornelius Ave
- 107 1st Place
- 8 Van Cott Place
- 1896 Russell St
- 3070 Lowell Ave
- 2730 Court St
- 2489 Beltagh Ave
- 2009 Newbridge Rd

Ask me questions while you tour the home.