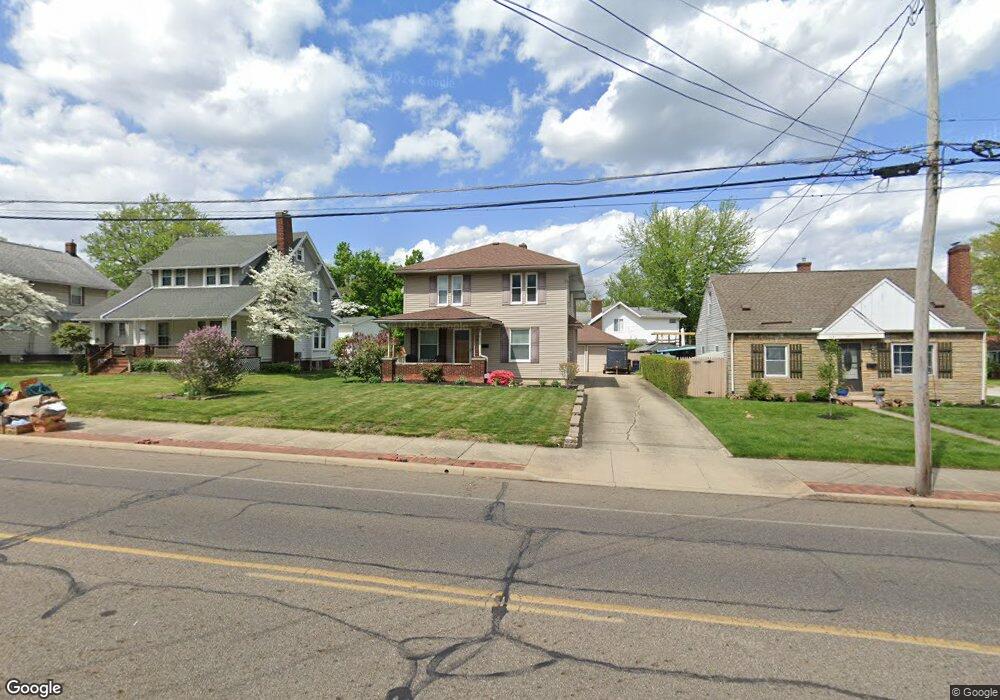
2729 Albrecht Ave Akron, OH 44312
Ellet NeighborhoodEstimated Value: $171,285 - $204,000
4
Beds
1
Bath
1,628
Sq Ft
$116/Sq Ft
Est. Value
About This Home
This home is located at 2729 Albrecht Ave, Akron, OH 44312 and is currently estimated at $188,071, approximately $115 per square foot. 2729 Albrecht Ave is a home located in Summit County with nearby schools including Ellet High School, Summit Academy Akron Elementary School, and Hatton Community Learning Center.
Ownership History
Date
Name
Owned For
Owner Type
Purchase Details
Closed on
Oct 7, 2005
Sold by
The Bank Of New York
Bought by
Blomgren Freeman Valinda K
Current Estimated Value
Home Financials for this Owner
Home Financials are based on the most recent Mortgage that was taken out on this home.
Original Mortgage
$63,050
Outstanding Balance
$33,875
Interest Rate
5.82%
Mortgage Type
Fannie Mae Freddie Mac
Estimated Equity
$154,196
Purchase Details
Closed on
Mar 30, 2005
Sold by
Lane Carol M
Bought by
The Bank Of New York and The Eqcc Asset Backed Certificates Serie
Purchase Details
Closed on
Jun 23, 1999
Sold by
Harvey David E and Harvey Darlene J
Bought by
Lane Carol M and Garman Sondra A
Home Financials for this Owner
Home Financials are based on the most recent Mortgage that was taken out on this home.
Original Mortgage
$97,650
Interest Rate
7.15%
Purchase Details
Closed on
Feb 28, 1997
Sold by
Terepka Raymond F
Bought by
Harvey David E and Harvey Darlene J
Home Financials for this Owner
Home Financials are based on the most recent Mortgage that was taken out on this home.
Original Mortgage
$47,975
Interest Rate
6%
Mortgage Type
New Conventional
Create a Home Valuation Report for This Property
The Home Valuation Report is an in-depth analysis detailing your home's value as well as a comparison with similar homes in the area
Home Values in the Area
Average Home Value in this Area
Purchase History
| Date | Buyer | Sale Price | Title Company |
|---|---|---|---|
| Blomgren Freeman Valinda K | $65,000 | -- | |
| The Bank Of New York | $66,000 | -- | |
| Lane Carol M | $90,000 | -- | |
| Harvey David E | $50,500 | -- |
Source: Public Records
Mortgage History
| Date | Status | Borrower | Loan Amount |
|---|---|---|---|
| Open | Blomgren Freeman Valinda K | $63,050 | |
| Previous Owner | Lane Carol M | $97,650 | |
| Previous Owner | Harvey David E | $47,975 |
Source: Public Records
Tax History Compared to Growth
Tax History
| Year | Tax Paid | Tax Assessment Tax Assessment Total Assessment is a certain percentage of the fair market value that is determined by local assessors to be the total taxable value of land and additions on the property. | Land | Improvement |
|---|---|---|---|---|
| 2025 | $2,703 | $50,166 | $9,807 | $40,359 |
| 2024 | $2,703 | $50,166 | $9,807 | $40,359 |
| 2023 | $2,703 | $50,166 | $9,807 | $40,359 |
| 2022 | $2,501 | $36,337 | $7,056 | $29,281 |
| 2021 | $2,504 | $36,337 | $7,056 | $29,281 |
| 2020 | $2,466 | $36,340 | $7,060 | $29,280 |
| 2019 | $2,125 | $28,170 | $7,060 | $21,110 |
| 2018 | $2,097 | $28,170 | $7,060 | $21,110 |
| 2017 | $1,890 | $28,170 | $7,060 | $21,110 |
| 2016 | $1,892 | $24,790 | $7,060 | $17,730 |
| 2015 | $1,890 | $24,790 | $7,060 | $17,730 |
| 2014 | $1,876 | $24,790 | $7,060 | $17,730 |
| 2013 | $1,846 | $24,900 | $7,060 | $17,840 |
Source: Public Records
Map
Nearby Homes
- 490 Stevenson Ave
- 412 Stevenson Ave
- 440 Wirth Ave
- 423 Stetler Ave
- 544 Dennison Ave
- 307 Pauline Ave
- 256 High Grove Blvd
- 379 Stull Ave
- 2528 Ogden Ave
- 2948 Trenton Rd
- 2487 Delaware Ave
- 905 1/2 Shadybrook Dr
- 0 Kreiner Ave
- 117 Kreiner Ave
- 805 Utica Ave
- 2863 Burnside St
- 2155 Abbey Rd
- 47 Kreiner Ave
- 880 Utica Ave
- 6 Kreiner Ave
- 2723 Albrecht Ave
- 2735 Albrecht Ave
- 2717 Albrecht Ave
- 511 Wirth Ave
- 2732 Albrecht Ave
- 495 Stevenson Ave
- 487 Stevenson Ave
- 2749 Albrecht Ave
- 2738 Albrecht Ave
- 2714 Albrecht Ave
- 2707 Albrecht Ave
- 478 Stevenson Ave
- 503 Wirth Ave
- 2744 Albrecht Ave
- 2730 Albrecht Ave
- 2706 Albrecht Ave
- 2701 Albrecht Ave
- 479 Stevenson Ave
- 495 Wirth Ave
- 510 Wirth Ave