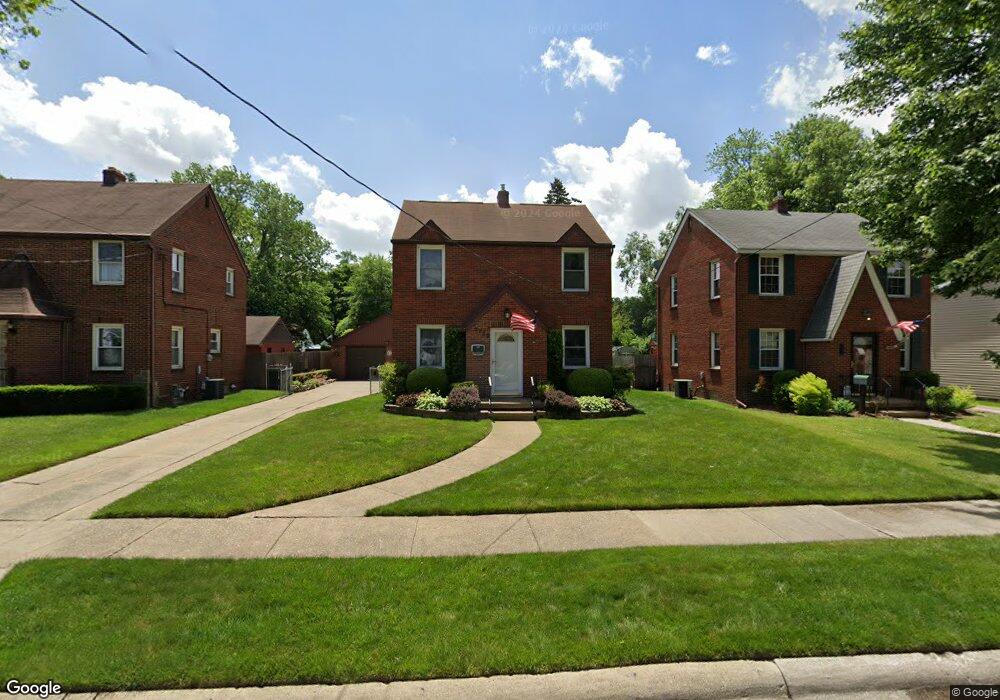
2729 Burwell Dr Toledo, OH 43609
Southside NeighborhoodEstimated Value: $104,000 - $127,000
3
Beds
1
Bath
1,184
Sq Ft
$97/Sq Ft
Est. Value
About This Home
This home is located at 2729 Burwell Dr, Toledo, OH 43609 and is currently estimated at $114,612, approximately $96 per square foot. 2729 Burwell Dr is a home located in Lucas County with nearby schools including Burroughs Elementary School, Bowsher High School, and Explorers Academy of Science and Technology.
Ownership History
Date
Name
Owned For
Owner Type
Purchase Details
Closed on
Oct 17, 2016
Sold by
2729 Burwell Llc
Bought by
Young Caroline
Current Estimated Value
Home Financials for this Owner
Home Financials are based on the most recent Mortgage that was taken out on this home.
Original Mortgage
$54,003
Outstanding Balance
$43,687
Interest Rate
3.75%
Mortgage Type
FHA
Estimated Equity
$70,925
Purchase Details
Closed on
Nov 22, 2013
Sold by
Comes Michael Brandon and Comes Michael B
Bought by
Burwell Llc
Purchase Details
Closed on
May 22, 2000
Sold by
Comes Maureen J and Keller Maureen Judith
Bought by
Comes Michael Brandon
Purchase Details
Closed on
Mar 7, 1997
Sold by
Hoover Richard J
Bought by
Keller Maureen J and Come Michael B
Home Financials for this Owner
Home Financials are based on the most recent Mortgage that was taken out on this home.
Original Mortgage
$54,800
Interest Rate
7.93%
Mortgage Type
New Conventional
Purchase Details
Closed on
Oct 5, 1990
Sold by
Schlender Grace E
Create a Home Valuation Report for This Property
The Home Valuation Report is an in-depth analysis detailing your home's value as well as a comparison with similar homes in the area
Home Values in the Area
Average Home Value in this Area
Purchase History
| Date | Buyer | Sale Price | Title Company |
|---|---|---|---|
| Young Caroline | $55,000 | None Available | |
| Burwell Llc | -- | None Available | |
| Comes Michael Brandon | -- | -- | |
| Keller Maureen J | $68,500 | -- | |
| -- | $55,000 | -- |
Source: Public Records
Mortgage History
| Date | Status | Borrower | Loan Amount |
|---|---|---|---|
| Open | Young Caroline | $54,003 | |
| Previous Owner | Keller Maureen J | $54,800 |
Source: Public Records
Tax History Compared to Growth
Tax History
| Year | Tax Paid | Tax Assessment Tax Assessment Total Assessment is a certain percentage of the fair market value that is determined by local assessors to be the total taxable value of land and additions on the property. | Land | Improvement |
|---|---|---|---|---|
| 2024 | $1,079 | $34,825 | $6,615 | $28,210 |
| 2023 | $1,612 | $24,360 | $5,950 | $18,410 |
| 2022 | $1,618 | $24,360 | $5,950 | $18,410 |
| 2021 | $1,654 | $24,360 | $5,950 | $18,410 |
| 2020 | $1,732 | $22,540 | $5,495 | $17,045 |
| 2019 | $1,681 | $22,540 | $5,495 | $17,045 |
| 2018 | $1,717 | $22,540 | $5,495 | $17,045 |
| 2017 | $1,713 | $21,805 | $5,390 | $16,415 |
| 2016 | $1,757 | $62,300 | $15,400 | $46,900 |
| 2015 | $1,743 | $62,300 | $15,400 | $46,900 |
| 2014 | $1,410 | $21,810 | $5,390 | $16,420 |
| 2013 | $1,410 | $21,810 | $5,390 | $16,420 |
Source: Public Records
Map
Nearby Homes
- 2828 South Ave
- 2437 Airport Hwy
- 546 Elmdale Rd
- 569 Apple Ave
- 663 Foredale Ave
- 541 Apple Ave
- 728 Foredale Ave
- 560 Williamsville Ave
- 2332 Airline Ave
- 518 Myers St
- 838 Wylie Ave
- 1351 Bensch Dr
- 552 Wyman St
- 321 Mayberry St
- 440 Somerset St
- 940 Francis Ave
- 531 Shasta Dr
- 1022 National Ave
- 226 Somerset St
- 649 Wright Ave
- 2725 Burwell Dr
- 2721 Burwell Dr
- 707 Barclay Dr
- 711 Barclay Dr
- 2713 Burwell Dr
- 703 Barclay Dr
- 715 Barclay Dr
- 719 Barclay Dr
- 2730 Stateview Dr
- 2734 Stateview Dr
- 2722 Stateview Dr
- 723 Barclay Dr
- 2718 Stateview Dr
- 2730 Burwell Dr
- 2726 Burwell Dr
- 651 Barclay Dr
- 2722 Burwell Dr
- 2734 Burwell Dr
- 712 Caswell Ave
- 708 Caswell Ave