Estimated Value: $576,000 - $632,620
4
Beds
3
Baths
3,360
Sq Ft
$180/Sq Ft
Est. Value
About This Home
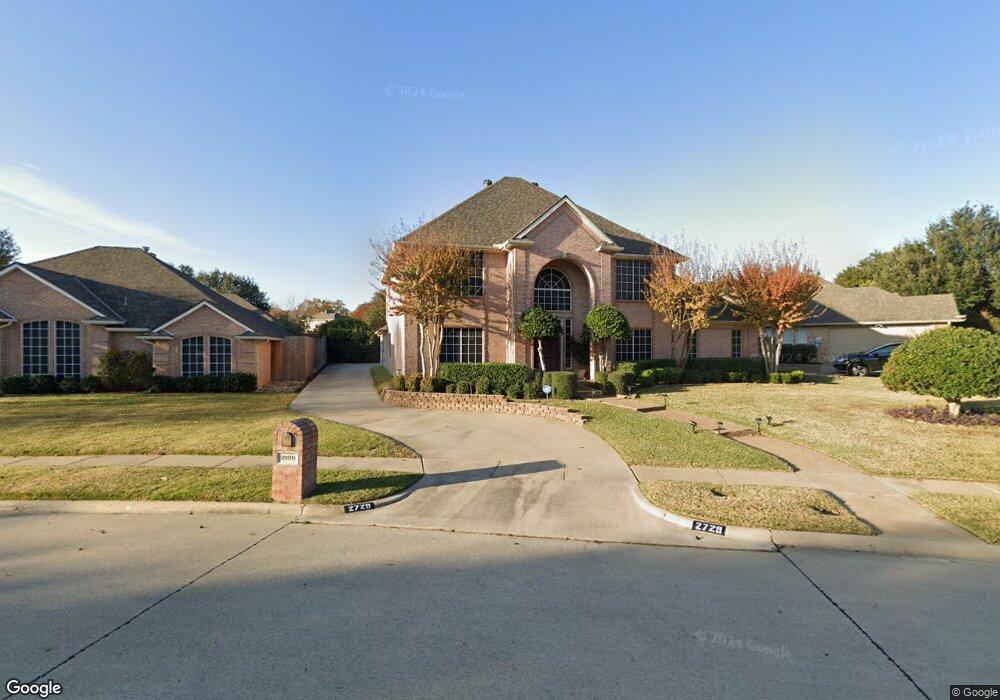
This home is located at 2729 Mill Haven Dr, Hurst, TX 76054 and is currently estimated at $606,155, approximately $180 per square foot. 2729 Mill Haven Dr is a home located in Tarrant County with nearby schools including Bransford Elementary School, Colleyville Middle School, and Grapevine High School.
Ownership History
Date
Name
Owned For
Owner Type
Purchase Details
Closed on
Dec 15, 1999
Sold by
Kettle Richard D and Kettle Corinne M
Bought by
Jackson Odie M and Jackson Carol F
Current Estimated Value
Home Financials for this Owner
Home Financials are based on the most recent Mortgage that was taken out on this home.
Original Mortgage
$171,750
Outstanding Balance
$53,766
Interest Rate
7.86%
Estimated Equity
$552,389
Purchase Details
Closed on
Feb 8, 1994
Sold by
Bullough Interests Inc
Bought by
Kettle Richard D and Kettle Corinne M
Home Financials for this Owner
Home Financials are based on the most recent Mortgage that was taken out on this home.
Original Mortgage
$167,600
Interest Rate
7.25%
Create a Home Valuation Report for This Property
The Home Valuation Report is an in-depth analysis detailing your home's value as well as a comparison with similar homes in the area
Home Values in the Area
Average Home Value in this Area
Purchase History
| Date | Buyer | Sale Price | Title Company |
|---|---|---|---|
| Jackson Odie M | -- | Southwest Land Title | |
| Kettle Richard D | -- | Safeco Land Title Co |
Source: Public Records
Mortgage History
| Date | Status | Borrower | Loan Amount |
|---|---|---|---|
| Open | Jackson Odie M | $171,750 | |
| Previous Owner | Kettle Richard D | $167,600 | |
| Closed | Jackson Odie M | $46,000 |
Source: Public Records
Tax History Compared to Growth
Tax History
| Year | Tax Paid | Tax Assessment Tax Assessment Total Assessment is a certain percentage of the fair market value that is determined by local assessors to be the total taxable value of land and additions on the property. | Land | Improvement |
|---|---|---|---|---|
| 2025 | $2,844 | $475,000 | $85,000 | $390,000 |
| 2024 | $2,844 | $583,000 | $85,000 | $498,000 |
| 2023 | $10,413 | $583,726 | $85,000 | $498,726 |
| 2022 | $10,958 | $471,648 | $55,000 | $416,648 |
| 2021 | $11,856 | $474,653 | $55,000 | $419,653 |
| 2020 | $10,760 | $428,248 | $55,000 | $373,248 |
| 2019 | $10,823 | $430,884 | $55,000 | $375,884 |
| 2018 | $2,849 | $382,663 | $55,000 | $327,663 |
| 2017 | $9,084 | $398,867 | $55,000 | $343,867 |
| 2016 | $8,258 | $350,523 | $40,000 | $310,523 |
| 2015 | $5,685 | $287,500 | $25,000 | $262,500 |
| 2014 | $5,685 | $287,500 | $25,000 | $262,500 |
Source: Public Records
Map
Nearby Homes
- 312 Bremen Dr
- 405 Bremen Dr
- 4600 Bransford Rd
- 2732 Woodbridge Dr
- 2852 Winterhaven Dr
- 3713 Brentwood Ct
- 114 Glade Rd
- 2844 Hurstview Dr
- 112 Glade Rd
- 2620 Brookridge Dr
- 3132 Hurstview Dr
- 3208 Glade Pointe Ct
- 2809 Sandstone Dr
- 2829 Sandstone Dr
- 405 Woodbriar Ct
- 628 Huntwich Dr
- 1921 Maplewood Trail
- 2804 Ridgewood Dr
- 2908 Steve Dr
- 3228 Oakdale Dr
- 111 Heneretta Dr
- 2725 Mill Haven Dr
- 110 Marseille Dr
- 113 Heneretta Dr
- 108 Marseille Dr
- 2721 Mill Haven Dr
- 2724 Mill Haven Dr
- 104 Marseille Dr
- 2720 Mill Haven Dr
- 115 Heneretta Dr
- 112 Marseille Dr
- 106 Heneretta Dr
- 108 Heneretta Dr
- 2717 Mill Haven Dr
- 104 Heneretta Dr
- 110 Heneretta Dr
- 100 Marseille Dr
- 2716 Mill Haven Dr
- 117 Heneretta Dr
- 107 Heneretta Dr