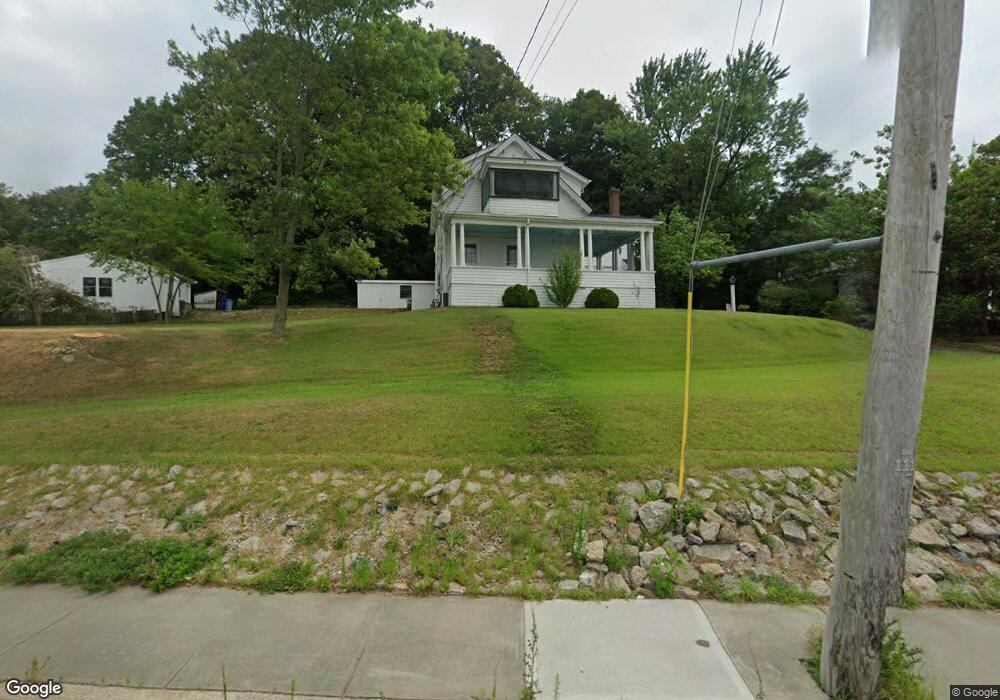
2729 N Main St Fall River, MA 02720
Western Fall River NeighborhoodEstimated Value: $400,000 - $531,000
5
Beds
2
Baths
2,167
Sq Ft
$213/Sq Ft
Est. Value
About This Home
This home is located at 2729 N Main St, Fall River, MA 02720 and is currently estimated at $462,172, approximately $213 per square foot. 2729 N Main St is a home located in Bristol County with nearby schools including North End Elementary School, Morton Middle School, and B M C Durfee High School.
Ownership History
Date
Name
Owned For
Owner Type
Purchase Details
Closed on
Oct 27, 1994
Sold by
Pelletier Donna
Bought by
Arruda Frank and Arruda Rosalie
Current Estimated Value
Home Financials for this Owner
Home Financials are based on the most recent Mortgage that was taken out on this home.
Original Mortgage
$123,500
Interest Rate
8.65%
Mortgage Type
Purchase Money Mortgage
Create a Home Valuation Report for This Property
The Home Valuation Report is an in-depth analysis detailing your home's value as well as a comparison with similar homes in the area
Home Values in the Area
Average Home Value in this Area
Purchase History
| Date | Buyer | Sale Price | Title Company |
|---|---|---|---|
| Arruda Frank | $130,000 | -- |
Source: Public Records
Mortgage History
| Date | Status | Borrower | Loan Amount |
|---|---|---|---|
| Open | Arruda Frank | $134,000 | |
| Closed | Arruda Frank | $25,400 | |
| Closed | Arruda Frank | $130,000 | |
| Closed | Arruda Frank | $123,500 |
Source: Public Records
Tax History
| Year | Tax Paid | Tax Assessment Tax Assessment Total Assessment is a certain percentage of the fair market value that is determined by local assessors to be the total taxable value of land and additions on the property. | Land | Improvement |
|---|---|---|---|---|
| 2025 | $4,498 | $392,800 | $132,500 | $260,300 |
| 2024 | $4,154 | $361,500 | $127,400 | $234,100 |
| 2023 | $3,834 | $312,500 | $109,200 | $203,300 |
| 2022 | $3,537 | $280,300 | $99,300 | $181,000 |
| 2021 | $3,474 | $251,200 | $91,900 | $159,300 |
| 2020 | $3,146 | $217,700 | $87,900 | $129,800 |
| 2019 | $2,986 | $204,800 | $83,800 | $121,000 |
| 2018 | $2,839 | $194,200 | $82,200 | $112,000 |
| 2017 | $2,666 | $190,400 | $83,900 | $106,500 |
| 2016 | $2,610 | $191,500 | $87,300 | $104,200 |
| 2015 | $2,463 | $188,300 | $84,100 | $104,200 |
| 2014 | $2,526 | $200,800 | $88,500 | $112,300 |
Source: Public Records
Map
Nearby Homes
- 33 Warner St
- 257 Calvin St
- 1810 Highland Ave Unit 22
- Parcel 2 Highcrest Rd
- 29 Valentine St
- 274 Archer St
- 195 Crescent St Unit 3
- 108 Stowe St Unit 108
- 3636 N Main St Unit 5
- 210 Harrison Ave
- 247 Albany St
- 1553 Riverside Ave
- 230 College Park Rd
- 201 Montgomery Cir
- 333 Langley St
- 1496 Riverside Ave
- 2714 Riverside Ave
- 17 Langley St
- 2106 Meridian St
- 208 Florence St
- 31 Haskell St
- New Lot 5 N Main St
- 2759 N Main St
- 51 Haskell St
- 38 Haskell St
- 2779 N Main St
- 50 Haskell St
- 2787 N Main St
- 2676 N Main St
- 2684 N Main St
- 2675 N Main St
- 2671 N Main St
- 2671 N Main St Unit 2
- 2676-2678 N Main St
- 66 Haskell St
- 51 Holland St
- 2791 N Main St
- 2791 N Main St Unit 2
- 2674 N Main St
- 2663 N Main St
Your Personal Tour Guide
Ask me questions while you tour the home.