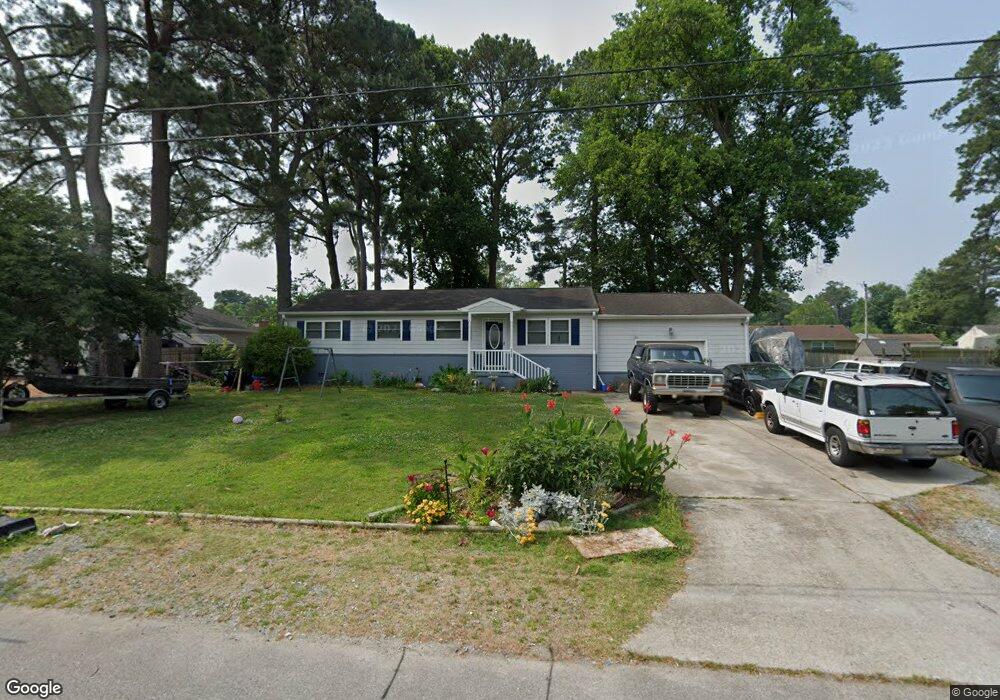
2729 N Nansemond Dr Suffolk, VA 23435
Sleepy Hole NeighborhoodEstimated Value: $304,284 - $308,000
3
Beds
2
Baths
1,215
Sq Ft
$252/Sq Ft
Est. Value
About This Home
This home is located at 2729 N Nansemond Dr, Suffolk, VA 23435 and is currently estimated at $306,571, approximately $252 per square foot. 2729 N Nansemond Dr is a home located in Suffolk City with nearby schools including Driver Elementary School, John Yeates Middle School, and Nansemond River High School.
Ownership History
Date
Name
Owned For
Owner Type
Purchase Details
Closed on
Nov 23, 2020
Sold by
Amble Home Llc
Bought by
Francis David B
Current Estimated Value
Home Financials for this Owner
Home Financials are based on the most recent Mortgage that was taken out on this home.
Original Mortgage
$203,250
Interest Rate
2.9%
Mortgage Type
FHA
Purchase Details
Closed on
May 5, 2018
Sold by
Kirby Andrew W
Bought by
Amble Home Llc A Virginia Limited Liabil
Create a Home Valuation Report for This Property
The Home Valuation Report is an in-depth analysis detailing your home's value as well as a comparison with similar homes in the area
Home Values in the Area
Average Home Value in this Area
Purchase History
| Date | Buyer | Sale Price | Title Company |
|---|---|---|---|
| Francis David B | $207,000 | Alpha 1 Title & Escrow Llc | |
| Amble Home Llc A Virginia Limited Liabil | -- | None Available |
Source: Public Records
Mortgage History
| Date | Status | Borrower | Loan Amount |
|---|---|---|---|
| Open | Francis David B | $7,245 | |
| Previous Owner | Francis David B | $203,250 |
Source: Public Records
Tax History Compared to Growth
Tax History
| Year | Tax Paid | Tax Assessment Tax Assessment Total Assessment is a certain percentage of the fair market value that is determined by local assessors to be the total taxable value of land and additions on the property. | Land | Improvement |
|---|---|---|---|---|
| 2024 | $3,356 | $264,600 | $76,100 | $188,500 |
| 2023 | $3,224 | $259,600 | $76,100 | $183,500 |
| 2022 | $2,711 | $248,700 | $76,100 | $172,600 |
| 2021 | $2,300 | $207,200 | $63,400 | $143,800 |
| 2020 | $2,093 | $188,600 | $63,400 | $125,200 |
| 2019 | $2,122 | $191,200 | $63,400 | $127,800 |
| 2018 | $2,186 | $190,400 | $63,400 | $127,000 |
| 2017 | $1,988 | $185,800 | $63,400 | $122,400 |
| 2016 | $1,988 | $185,800 | $63,400 | $122,400 |
| 2015 | $1,038 | $185,800 | $63,400 | $122,400 |
| 2014 | $1,038 | $185,800 | $63,400 | $122,400 |
Source: Public Records
Map
Nearby Homes
- 5517 S Lake Rd
- 1013 Strawberry Ct
- 1009 Strawberry Ct
- 214 Retreat Dr
- 126 Creek Front Ln
- 144 Creek Front Ln
- 216 Preservation Reach
- 5210 Bennetts Pasture Rd
- 223 Creek Front Ln
- 113 Windy Point Dr
- 121 Windy Point Dr
- 201 Cove Reach
- 119 Creek Ln
- 3419 Raintree Cir
- 116 Creek Ln
- 109 Riverside Dr
- 110 Creek Ln
- 5057 Bennetts Pasture Rd
- 100 Creek Ln
- Lot197 Raintree Cir
- 2725 N Nansemond Dr
- 2725 N Nansemond Dr
- 2737 N Nansemond Dr
- 2736 Colonial Dr
- 2732 Colonial Dr
- 2732 N Nansemond Dr
- 2740 Colonial Dr
- 2728 Colonial Dr
- 2728 N Nansemond Dr
- 2721 N Nansemond Dr
- 2721 N Nansemond Dr
- 5525 Holly Rd
- 2724 Colonial Dr
- 2724 N Nansemond Dr
- 2741 Colonial Dr
- 2737 Colonial Dr
- 2717 N Nansemond Dr
- 2801 N Nansemond Dr
- 2745 Colonial Dr Unit Dr
- 2733 Colonial Dr