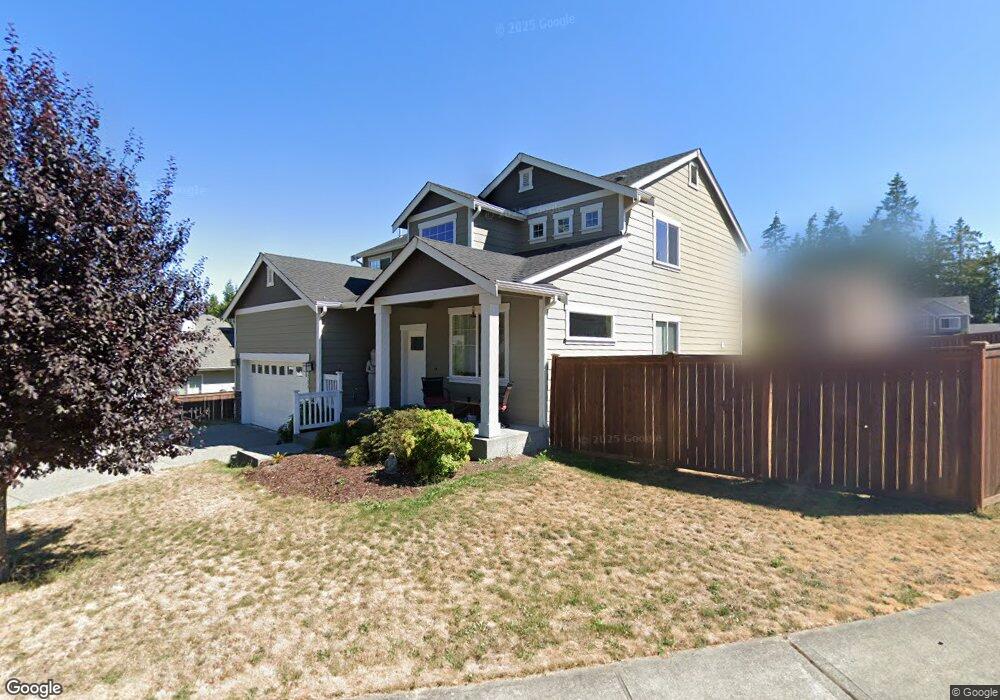
2729 NE Noll Valley Loop Poulsbo, WA 98370
Estimated Value: $689,422 - $771,000
4
Beds
3
Baths
2,225
Sq Ft
$327/Sq Ft
Est. Value
About This Home
This home is located at 2729 NE Noll Valley Loop, Poulsbo, WA 98370 and is currently estimated at $728,606, approximately $327 per square foot. 2729 NE Noll Valley Loop is a home located in Kitsap County with nearby schools including Poulsbo Elementary School, Poulsbo Middle School, and North Kitsap High School.
Ownership History
Date
Name
Owned For
Owner Type
Purchase Details
Closed on
Dec 8, 2022
Sold by
Martin Joshua Travis
Bought by
Rauch Kimberly Ann
Current Estimated Value
Purchase Details
Closed on
Oct 20, 2012
Sold by
Rauch Kimberly A
Bought by
Rauch Kimberly A and Martin Joshua T
Home Financials for this Owner
Home Financials are based on the most recent Mortgage that was taken out on this home.
Original Mortgage
$201,000
Interest Rate
3.5%
Mortgage Type
New Conventional
Purchase Details
Closed on
Mar 16, 2012
Sold by
Tm Homes Llc
Bought by
Rauch Kimberly A
Home Financials for this Owner
Home Financials are based on the most recent Mortgage that was taken out on this home.
Original Mortgage
$201,000
Interest Rate
3.12%
Mortgage Type
New Conventional
Purchase Details
Closed on
Jun 23, 2011
Sold by
Noll Valley Llc
Bought by
First Horizon Home Loans
Create a Home Valuation Report for This Property
The Home Valuation Report is an in-depth analysis detailing your home's value as well as a comparison with similar homes in the area
Home Values in the Area
Average Home Value in this Area
Purchase History
| Date | Buyer | Sale Price | Title Company |
|---|---|---|---|
| Rauch Kimberly Ann | -- | -- | |
| Rauch Kimberly A | $99,082 | First American Title Ins | |
| Rauch Kimberly A | $280,230 | First American Title Ins | |
| First Horizon Home Loans | $2,499,000 | None Available |
Source: Public Records
Mortgage History
| Date | Status | Borrower | Loan Amount |
|---|---|---|---|
| Previous Owner | Rauch Kimberly A | $201,000 | |
| Previous Owner | Rauch Kimberly A | $201,000 |
Source: Public Records
Tax History Compared to Growth
Tax History
| Year | Tax Paid | Tax Assessment Tax Assessment Total Assessment is a certain percentage of the fair market value that is determined by local assessors to be the total taxable value of land and additions on the property. | Land | Improvement |
|---|---|---|---|---|
| 2026 | $5,300 | $602,320 | $113,760 | $488,560 |
| 2025 | $5,300 | $602,320 | $113,760 | $488,560 |
| 2024 | $5,127 | $600,590 | $106,370 | $494,220 |
| 2023 | $5,213 | $600,590 | $106,370 | $494,220 |
| 2022 | $4,607 | $505,540 | $92,340 | $413,200 |
| 2021 | $4,452 | $452,720 | $82,730 | $369,990 |
| 2020 | $4,329 | $432,830 | $79,040 | $353,790 |
| 2019 | $4,059 | $406,050 | $73,870 | $332,180 |
| 2018 | $3,659 | $311,220 | $56,100 | $255,120 |
| 2017 | $3,488 | $311,220 | $56,100 | $255,120 |
| 2016 | $3,567 | $292,990 | $56,100 | $236,890 |
| 2015 | $3,436 | $283,880 | $56,100 | $227,780 |
| 2014 | -- | $271,130 | $56,100 | $215,030 |
| 2013 | -- | $271,130 | $56,100 | $215,030 |
Source: Public Records
Map
Nearby Homes
- 2496 NE Ariel Ct
- 2776 NE Noll Valley Loop
- 2416 NE Dynasty Dr
- 19680 Noll Rd NE
- 20274 Pugh Rd NE
- 20248 Pugh Rd NE
- 1711 NE Outlook Way
- 123 Pugh Rd NE
- 19370 NE Larson Ct
- 19226 Sandvik Place NE
- 1754 NE Mesford Rd Unit 12
- 1754 NE Mesford Rd Unit 28
- 20165 Bue Rund Loop NE
- 1343 Lena Place NE
- 1257 Cameo Ct NE
- 1330 NE Watland St
- 19328 Widme Rd NE
- 0 Bond Rd NE
- 18552 15th Loop NE
- 20249 State Highway 305 NE
- 2735 NE Noll Valley Loop
- 2723 NE Noll Valley Loop
- 2741 NE Noll Valley Loop
- 2717 NE Noll Valley Loop
- 2704 NE Noll Valley Loop
- 2698 NE Noll Valley Loop
- 2710 NE Noll Valley Loop
- 2728 NE Noll Valley Loop
- 2722 NE Noll Valley Loop
- 2711 NE Noll Valley Loop
- 2734 NE Noll Valley Loop
- 2747 NE Noll Valley Loop
- 2740 NE Noll Valley Loop
- 2705 NE Noll Valley Loop
- 2716 NE Noll Valley Loop
- 2686 NE Noll Valley Loop
- 2746 NE Noll Valley Loop
- 2753 NE Noll Valley Loop
- 2674 NE Noll Valley Loop
- 2668 NE Noll Valley Loop