E
Seller's Agent in 2019
Emily Olguin
Redhawk Real Estate, LLC
(405) 326-8600
1 in this area
60 Total Sales
Estimated Value: $242,582 - $258,000
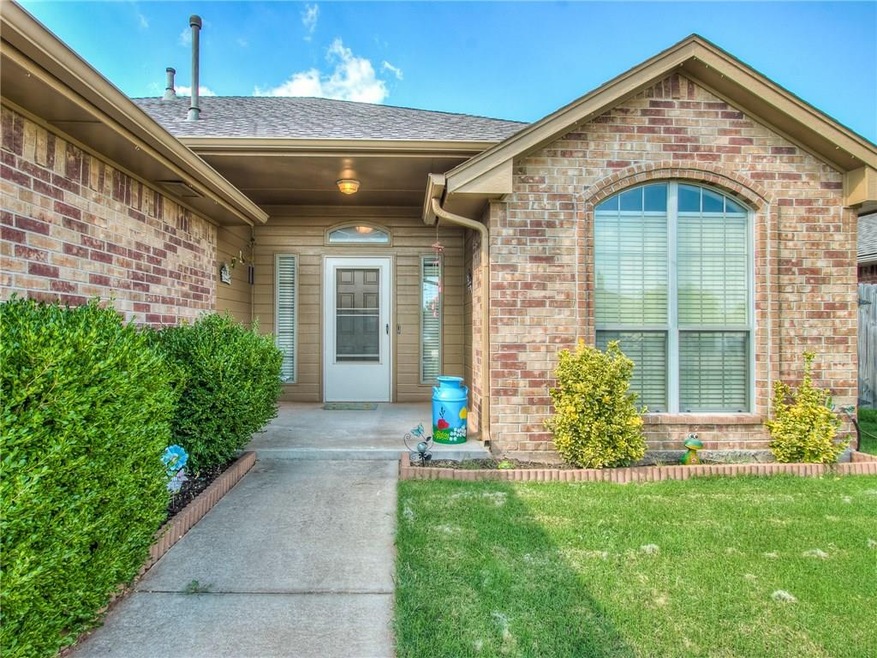
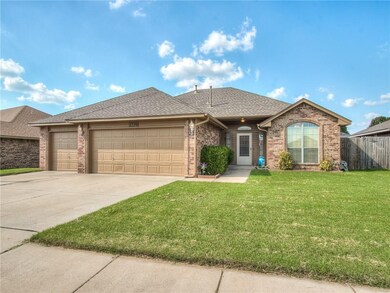
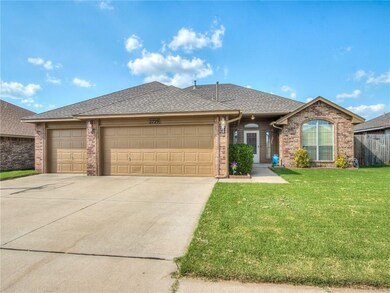
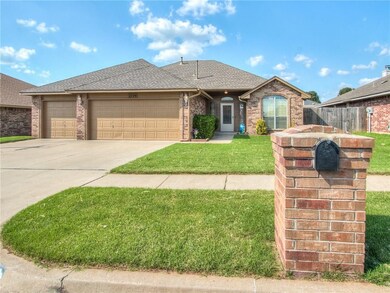
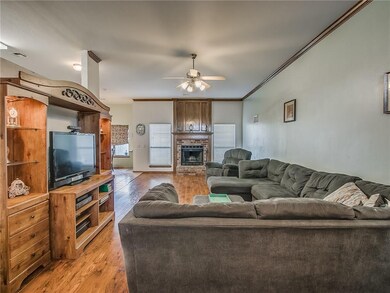
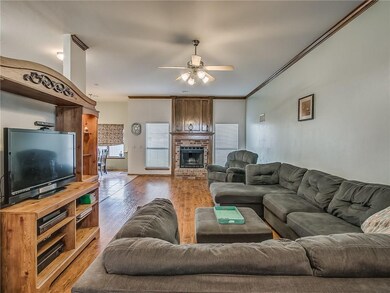
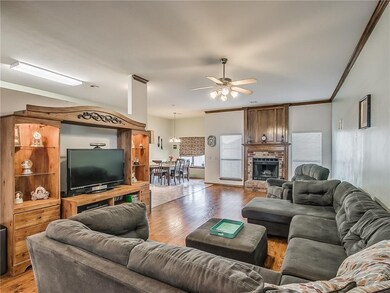
This beautiful home is ready to be yours! The large living is open to the kitchen and perfect for entertaining and boast wood flooring. The air conditioning was replaced in 2018 and there's a 12 person storm shelter located in the garage floor. The home is located near schools and shopping with easy access to highways. Call today for your private showing.
Last Agent to Sell the Property
Redhawk Real Estate, LLC License #149815 Listed on: 09/04/2019
Last Buyer's Agent
Julia Rusert
Brix Realty

| Date | Buyer | Sale Price | Title Company |
|---|---|---|---|
| Maxwell Taylor Amanda | $182,000 | American Eagle Title Group | |
| Hunt Aaron M | $141,500 | None Available | |
| Cliff Marcial Homes Inc | $17,500 | None Available |
| Date | Status | Borrower | Loan Amount |
|---|---|---|---|
| Open | Maxwell Taylor Amanda | $172,900 | |
| Previous Owner | Hunt Aaron M | $144,542 | |
| Previous Owner | Cliff Marcial Homes Inc | $113,520 |
| Date | Event | Price | List to Sale | Price per Sq Ft |
|---|---|---|---|---|
| 10/17/2019 10/17/19 | Sold | $182,000 | +1.7% | $105 / Sq Ft |
| 09/08/2019 09/08/19 | Pending | -- | -- | -- |
| 09/04/2019 09/04/19 | For Sale | $179,000 | -- | $104 / Sq Ft |
| Year | Tax Paid | Tax Assessment Tax Assessment Total Assessment is a certain percentage of the fair market value that is determined by local assessors to be the total taxable value of land and additions on the property. | Land | Improvement |
|---|---|---|---|---|
| 2025 | $3,143 | $25,631 | $3,816 | $21,815 |
| 2023 | $2,842 | $23,248 | $3,608 | $19,640 |
| 2022 | $2,742 | $22,141 | $3,780 | $18,361 |
| 2021 | $2,606 | $21,087 | $4,200 | $16,887 |
| 2020 | $2,560 | $20,646 | $4,200 | $16,446 |
| 2019 | $2,313 | $18,440 | $2,810 | $15,630 |
| 2018 | $2,228 | $17,562 | $3,000 | $14,562 |
| 2017 | $2,231 | $17,562 | $0 | $0 |
| 2016 | $2,254 | $17,562 | $3,000 | $14,562 |
| 2015 | $2,083 | $17,562 | $3,000 | $14,562 |
| 2014 | $2,026 | $16,797 | $2,100 | $14,697 |
E
Seller's Agent in 2019
Emily Olguin
Redhawk Real Estate, LLC
(405) 326-8600
1 in this area
60 Total Sales
J
Buyer's Agent in 2019
Julia Rusert
Brix Realty
Source: MLSOK
MLS Number: 882240
APN: R0136287
Disclaimer: Certain information contained herein is derived from information provided by parties other than Homes.com. All information provided is deemed reliable, but is not guaranteed to be accurate and should be independently verified.
![]() Based on information submitted to the MLS GRID. All data is obtained from various sources and may not have been verified by broker or MLS GRID. Supplied Open House Information is subject to change without notice. All information should be independently reviewed and verified for accuracy. Properties may or may not be listed by the office/agent presenting the information. Some IDX listings have been excluded from this website. IDX information is provided exclusively for personal, non-commercial use, and may not be used for any purpose other than to identify prospective properties consumers may be interested in purchasing.
Based on information submitted to the MLS GRID. All data is obtained from various sources and may not have been verified by broker or MLS GRID. Supplied Open House Information is subject to change without notice. All information should be independently reviewed and verified for accuracy. Properties may or may not be listed by the office/agent presenting the information. Some IDX listings have been excluded from this website. IDX information is provided exclusively for personal, non-commercial use, and may not be used for any purpose other than to identify prospective properties consumers may be interested in purchasing.
Information is deemed reliable but not guaranteed.
This information is not verified for authenticity or accuracy, is not guaranteed and may not reflect all real estate activity in the market.
Copyright 2026 MLSOK, Inc. All rights reserved.
Based on information submitted to the MLS GRID
Ask me questions while you tour the home.