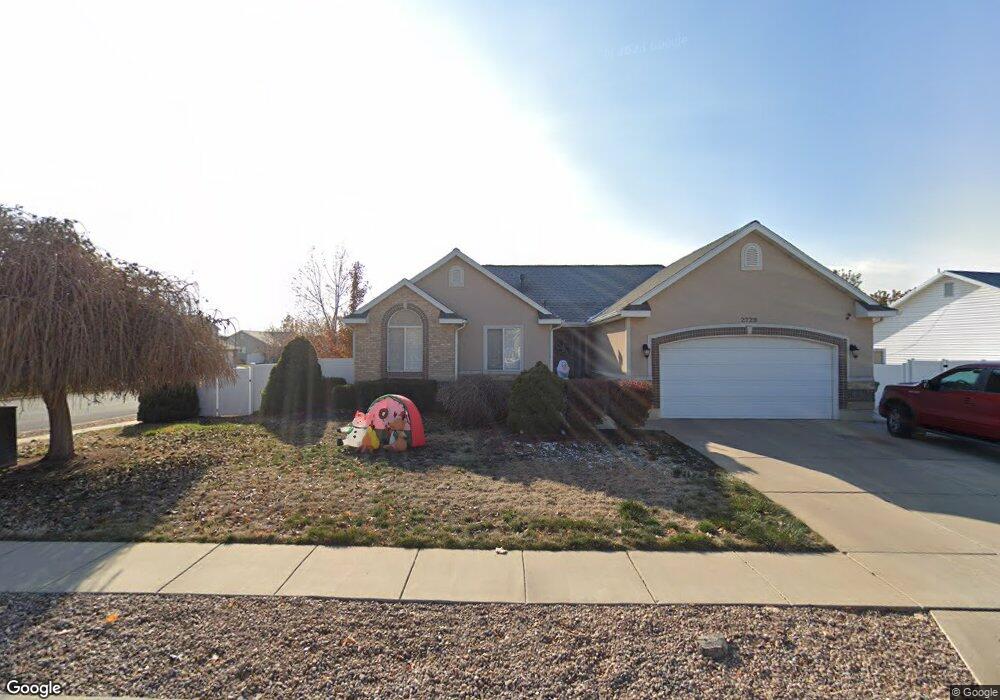
2729 W Lindi St Layton, UT 84041
Estimated Value: $479,000 - $518,000
5
Beds
3
Baths
2,404
Sq Ft
$209/Sq Ft
Est. Value
About This Home
This home is located at 2729 W Lindi St, Layton, UT 84041 and is currently estimated at $502,878, approximately $209 per square foot. 2729 W Lindi St is a home located in Davis County with nearby schools including Legacy Junior High School, Layton High School, and North Davis Preparatory Academy.
Ownership History
Date
Name
Owned For
Owner Type
Purchase Details
Closed on
Jun 1, 2017
Sold by
Skyline Holdings Group Llc
Bought by
Ogden Colton Chase and Hoang Thu My
Current Estimated Value
Home Financials for this Owner
Home Financials are based on the most recent Mortgage that was taken out on this home.
Original Mortgage
$306,450
Outstanding Balance
$254,290
Interest Rate
4.02%
Mortgage Type
VA
Estimated Equity
$248,588
Purchase Details
Closed on
May 31, 2017
Sold by
Skyline Holding Group Llc
Bought by
Ogden Colton Chase and Ogden Thu My
Home Financials for this Owner
Home Financials are based on the most recent Mortgage that was taken out on this home.
Original Mortgage
$306,450
Outstanding Balance
$254,290
Interest Rate
4.02%
Mortgage Type
VA
Estimated Equity
$248,588
Purchase Details
Closed on
Mar 1, 2017
Sold by
Etitle Insurance Agency
Bought by
Skyline Holding Group Llc
Purchase Details
Closed on
Jun 27, 2009
Sold by
Roos Michael D and Roos Michera L
Bought by
Vailahi David
Home Financials for this Owner
Home Financials are based on the most recent Mortgage that was taken out on this home.
Original Mortgage
$220,825
Interest Rate
4.87%
Mortgage Type
FHA
Purchase Details
Closed on
Feb 11, 2005
Sold by
Bown Flynn M and Bown Shelli
Bought by
Roos Michael D and Roos Michera L
Home Financials for this Owner
Home Financials are based on the most recent Mortgage that was taken out on this home.
Original Mortgage
$174,577
Interest Rate
5.73%
Mortgage Type
VA
Purchase Details
Closed on
Oct 9, 1996
Sold by
Rainey Construction Inc
Bought by
Bown Flynn M and Bown Shelli
Home Financials for this Owner
Home Financials are based on the most recent Mortgage that was taken out on this home.
Original Mortgage
$119,050
Interest Rate
8.1%
Mortgage Type
FHA
Purchase Details
Closed on
Jun 19, 1996
Sold by
Glauser Lynn
Bought by
Joe Rainey Construction
Home Financials for this Owner
Home Financials are based on the most recent Mortgage that was taken out on this home.
Original Mortgage
$8,490
Interest Rate
8.25%
Create a Home Valuation Report for This Property
The Home Valuation Report is an in-depth analysis detailing your home's value as well as a comparison with similar homes in the area
Home Values in the Area
Average Home Value in this Area
Purchase History
| Date | Buyer | Sale Price | Title Company |
|---|---|---|---|
| Ogden Colton Chase | -- | Select Title | |
| Ogden Colton Chase | -- | -- | |
| Skyline Holding Group Llc | $207,100 | -- | |
| Vailahi David | -- | Bonneville Superior Tit | |
| Roos Michael D | -- | Heritage West Title Ins Agen | |
| Bown Flynn M | -- | Bonneville Title Company Inc | |
| Rainey Construction Inc | -- | Bonneville Title Company Inc | |
| Joe Rainey Construction | -- | Security Title Company |
Source: Public Records
Mortgage History
| Date | Status | Borrower | Loan Amount |
|---|---|---|---|
| Open | Ogden Colton Chase | $306,450 | |
| Previous Owner | Vailahi David | $220,825 | |
| Previous Owner | Roos Michael D | $174,577 | |
| Previous Owner | Bown Flynn M | $119,050 | |
| Previous Owner | Joe Rainey Construction | $8,490 |
Source: Public Records
Tax History Compared to Growth
Tax History
| Year | Tax Paid | Tax Assessment Tax Assessment Total Assessment is a certain percentage of the fair market value that is determined by local assessors to be the total taxable value of land and additions on the property. | Land | Improvement |
|---|---|---|---|---|
| 2025 | $2,452 | $257,400 | $106,011 | $151,389 |
| 2024 | $2,367 | $250,250 | $117,133 | $133,117 |
| 2023 | $2,452 | $457,000 | $116,173 | $340,827 |
| 2022 | $2,641 | $267,300 | $72,471 | $194,829 |
| 2021 | $2,392 | $361,000 | $108,729 | $252,271 |
| 2020 | $2,148 | $311,000 | $91,501 | $219,499 |
| 2019 | $2,066 | $293,000 | $93,948 | $199,052 |
| 2018 | $1,896 | $270,000 | $82,392 | $187,608 |
| 2016 | $1,694 | $124,410 | $34,038 | $90,372 |
| 2015 | $1,630 | $113,685 | $34,038 | $79,647 |
| 2014 | $1,649 | $117,606 | $34,038 | $83,568 |
| 2013 | -- | $112,023 | $28,952 | $83,071 |
Source: Public Records
Map
Nearby Homes