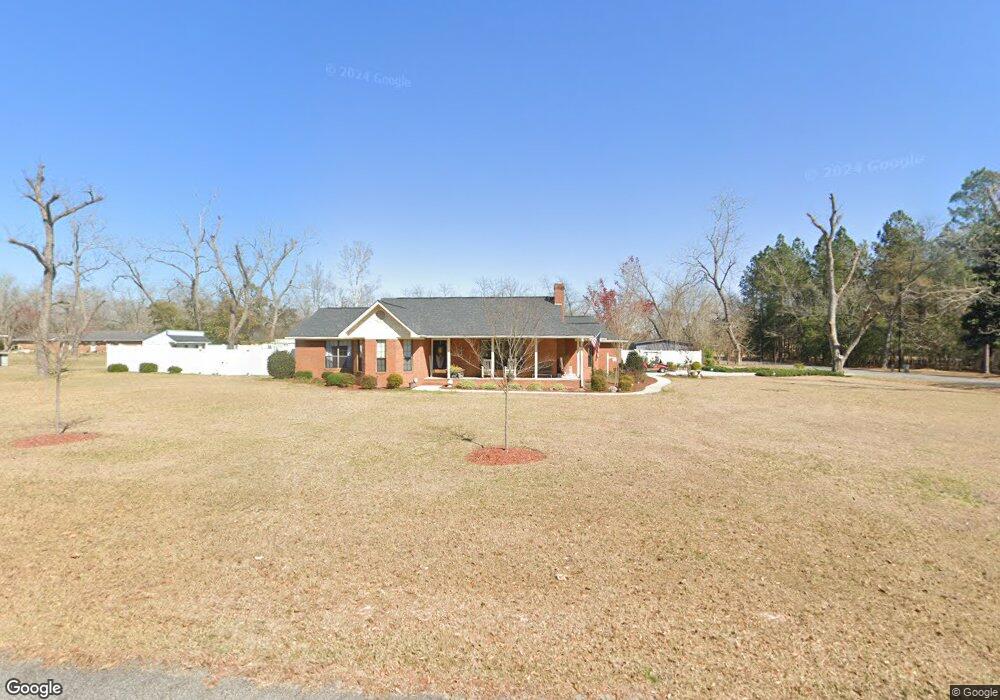
273 Ann Arbor Way Claxton, GA 30417
Estimated Value: $235,000 - $317,000
3
Beds
3
Baths
1,840
Sq Ft
$146/Sq Ft
Est. Value
About This Home
This home is located at 273 Ann Arbor Way, Claxton, GA 30417 and is currently estimated at $268,341, approximately $145 per square foot. 273 Ann Arbor Way is a home located in Evans County with nearby schools including Claxton Elementary School, Second Chance, and Claxton Middle School.
Ownership History
Date
Name
Owned For
Owner Type
Purchase Details
Closed on
Jun 30, 2016
Sold by
Smith Joseph Michael
Bought by
Walsh Larry T and Walsh Mary R
Current Estimated Value
Purchase Details
Closed on
May 11, 2012
Sold by
Massey Michael A
Bought by
Smith Joseph Michael
Home Financials for this Owner
Home Financials are based on the most recent Mortgage that was taken out on this home.
Original Mortgage
$105,000
Interest Rate
3.91%
Purchase Details
Closed on
Feb 26, 2007
Sold by
Not Provided
Bought by
Smith Joseph Michael
Home Financials for this Owner
Home Financials are based on the most recent Mortgage that was taken out on this home.
Original Mortgage
$110,000
Interest Rate
6.19%
Purchase Details
Closed on
Apr 8, 1999
Sold by
Burnsed Edwin L
Bought by
Burnsed Brenda C
Purchase Details
Closed on
Aug 14, 1995
Sold by
Youngblood Todd and Youngblood Sherry P
Bought by
Burnsed Edwin L
Create a Home Valuation Report for This Property
The Home Valuation Report is an in-depth analysis detailing your home's value as well as a comparison with similar homes in the area
Home Values in the Area
Average Home Value in this Area
Purchase History
| Date | Buyer | Sale Price | Title Company |
|---|---|---|---|
| Walsh Larry T | $149,000 | -- | |
| Smith Joseph Michael | $135,000 | -- | |
| Smith Joseph Michael | $120,000 | -- | |
| Massey April C | $120,000 | -- | |
| Burnsed Brenda C | -- | -- | |
| Burnsed Edwin L | $82,000 | -- |
Source: Public Records
Mortgage History
| Date | Status | Borrower | Loan Amount |
|---|---|---|---|
| Previous Owner | Smith Joseph Michael | $105,000 | |
| Previous Owner | Massey April C | $110,000 |
Source: Public Records
Tax History Compared to Growth
Tax History
| Year | Tax Paid | Tax Assessment Tax Assessment Total Assessment is a certain percentage of the fair market value that is determined by local assessors to be the total taxable value of land and additions on the property. | Land | Improvement |
|---|---|---|---|---|
| 2024 | $2,108 | $90,484 | $9,840 | $80,644 |
| 2023 | $1,423 | $48,920 | $4,920 | $44,000 |
| 2022 | $1,495 | $48,920 | $4,920 | $44,000 |
| 2021 | $1,448 | $48,920 | $4,920 | $44,000 |
| 2020 | $1,456 | $49,000 | $4,920 | $44,080 |
| 2019 | $1,416 | $49,000 | $4,920 | $44,080 |
| 2018 | $1,354 | $46,920 | $4,920 | $42,000 |
| 2017 | $1,206 | $47,560 | $4,920 | $42,640 |
| 2016 | $1,393 | $47,320 | $4,920 | $42,400 |
| 2015 | -- | $49,600 | $4,920 | $44,680 |
| 2014 | -- | $49,600 | $4,920 | $44,680 |
| 2013 | -- | $51,920 | $4,920 | $47,000 |
Source: Public Records
Map
Nearby Homes
- 19 Collins St
- 29 Grove Ln
- 0 Turnpike Rd Unit SA339603
- 19 Wysteria Ln
- 0 Dublin Rd
- 308 Old Metter Rd
- 712 Rosedale Ave
- 606 Park Ave
- 12 Wisteria Ln
- 12 Wysteria Ln
- 610 W Liberty St
- 10 Honeysuckle Dr
- 7 Honeysuckle Way
- 9 Honeysuckle Dr
- 7 Honeysuckle Dr
- 511 W Smith St
- 3 Honeysuckle Dr
- 4909 Perry Rd
- 3 S Spring St
- 107 Marguerite St
- 270 Ann Arbor Way
- 12 Woodlake Dr
- 225 Ann Arbor Way
- 18 Woodlake Dr
- 14 Meadowdale Place
- 30 Orchard Ln
- 240 Ann Arbor Way
- 34 Threatt St
- 210 Ann Arbor Way
- 400 Perkins Mill Rd
- 22 Meadowdale Place
- 290 Cypress St
- 286 Cypress St
- 404 Perkins Mill Rd
- 18 Issac Rd
- 0 Collins Unit 10287540
- 6028 Tattnall St
- 23 Collins
- 105 Cedar Ave
- 101 Cedar Ave