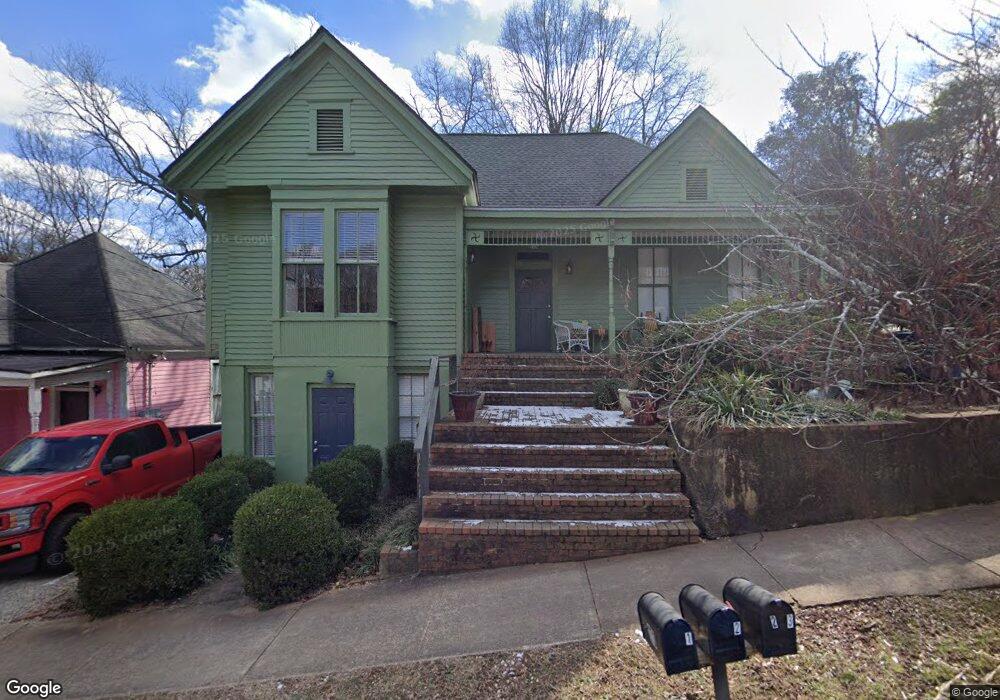
273 Barrow St Athens, GA 30601
Newtown NeighborhoodEstimated Value: $440,188 - $617,000
Studio
3
Baths
2,338
Sq Ft
$229/Sq Ft
Est. Value
About This Home
This home is located at 273 Barrow St, Athens, GA 30601 and is currently estimated at $535,797, approximately $229 per square foot. 273 Barrow St is a home located in Clarke County with nearby schools including Johnnie Lay Burks Elementary School, Clarke Middle School, and Clarke Central High School.
Ownership History
Date
Name
Owned For
Owner Type
Purchase Details
Closed on
Nov 15, 2012
Sold by
Small Anna H
Bought by
Peterson Christopher R
Current Estimated Value
Purchase Details
Closed on
Aug 30, 2012
Sold by
Piras Development Llc
Bought by
Small Anna H
Purchase Details
Closed on
Aug 15, 2008
Sold by
Mendicino Derek
Bought by
Piras Development Llc
Home Financials for this Owner
Home Financials are based on the most recent Mortgage that was taken out on this home.
Original Mortgage
$175,200
Interest Rate
6.21%
Mortgage Type
New Conventional
Purchase Details
Closed on
Jun 25, 1993
Sold by
Albertson Mark D and Albertson Ashley T
Bought by
Mendicino Derek and David Mendicino
Purchase Details
Closed on
May 31, 1990
Sold by
Connell Eula A
Bought by
Albertson Mark D and Albertson Ashley T
Create a Home Valuation Report for This Property
The Home Valuation Report is an in-depth analysis detailing your home's value as well as a comparison with similar homes in the area
Home Values in the Area
Average Home Value in this Area
Purchase History
| Date | Buyer | Sale Price | Title Company |
|---|---|---|---|
| Peterson Christopher R | $155,000 | -- | |
| Small Anna H | -- | -- | |
| Piras Development Llc | $207,000 | -- | |
| Mendicino Derek | $77,000 | -- | |
| Albertson Mark D | $72,600 | -- |
Source: Public Records
Mortgage History
| Date | Status | Borrower | Loan Amount |
|---|---|---|---|
| Previous Owner | Piras Development Llc | $175,200 |
Source: Public Records
Tax History
| Year | Tax Paid | Tax Assessment Tax Assessment Total Assessment is a certain percentage of the fair market value that is determined by local assessors to be the total taxable value of land and additions on the property. | Land | Improvement |
|---|---|---|---|---|
| 2025 | $3,464 | $188,656 | $40,000 | $148,656 |
| 2024 | $3,464 | $188,656 | $40,000 | $148,656 |
| 2023 | $5,895 | $188,656 | $40,000 | $148,656 |
| 2022 | $3,559 | $111,554 | $36,000 | $75,554 |
| 2021 | $2,742 | $81,360 | $32,000 | $49,360 |
| 2020 | $2,648 | $78,577 | $32,000 | $46,577 |
| 2019 | $2,528 | $74,464 | $32,000 | $42,464 |
| 2018 | $2,462 | $72,528 | $32,000 | $40,528 |
| 2017 | $2,410 | $70,974 | $36,000 | $34,974 |
| 2016 | $2,380 | $70,094 | $36,000 | $34,094 |
| 2015 | $2,363 | $69,488 | $36,000 | $33,488 |
| 2014 | $2,168 | $63,658 | $32,000 | $31,658 |
Source: Public Records
Map
Nearby Homes
- 100 Prince Ave Unit A404
- 100 Prince Ave Unit A407
- 600 Pulaski St
- 570 Prince Ave
- 940 College Ave
- 860 College Ave
- 641 W Hancock Ave
- 800 College Ave
- 269 N Hull St Unit 212
- 524 Hill St
- 390 Athens Ave
- 250 W Broad St Unit 615
- 250 W Broad St Unit 714
- 250 W Broad St Unit 408
- 330 Augusta Ave
- 247 E Washington St Unit 302
- 247 E Washington St Unit 308
- 247 E Washington St Unit 207
- 247 E Washington St Unit 504
- 131 E Broad St Unit 505
- 263 Barrow St
- 263 Barrow St Unit A
- 263 Barrow St Unit B
- 293 Barrow St
- 190 Barber St
- 243 Barrow St
- 180 Barber St
- 270 Barrow St
- 185 Childs St
- 183 Childs St
- 250 Barrow St
- 238 Barber St Unit A
- 238 Barber St
- 199 Barber St
- 197 Childs St Unit 2
- 197 Childs St
- 179 Childs St
- 170 Barber St
- 240 Barrow St
- 181 Barber St
Your Personal Tour Guide
Ask me questions while you tour the home.