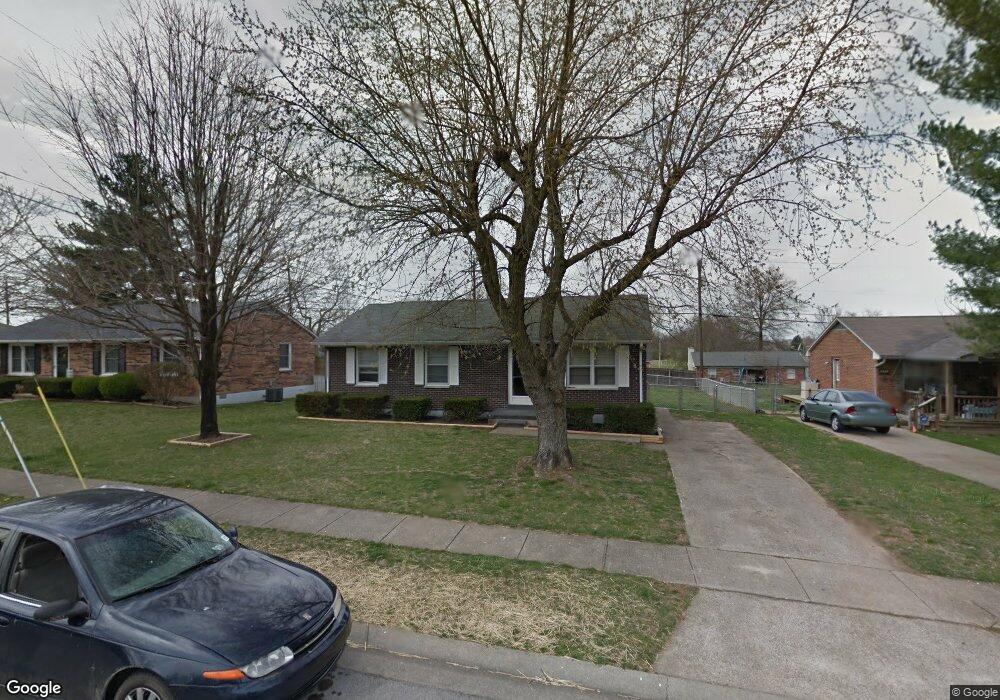
273 Biloxi Dr Nicholasville, KY 40356
South Nicholasville NeighborhoodEstimated Value: $176,000 - $217,000
3
Beds
1
Bath
1,050
Sq Ft
$184/Sq Ft
Est. Value
About This Home
This home is located at 273 Biloxi Dr, Nicholasville, KY 40356 and is currently estimated at $192,855, approximately $183 per square foot. 273 Biloxi Dr is a home located in Jessamine County with nearby schools including Nicholasville Elementary School, West Jessamine Middle School, and West Jessamine High School.
Ownership History
Date
Name
Owned For
Owner Type
Purchase Details
Closed on
Nov 26, 2024
Sold by
Day Tony
Bought by
Cx2 Investments Llc
Current Estimated Value
Home Financials for this Owner
Home Financials are based on the most recent Mortgage that was taken out on this home.
Original Mortgage
$194,352
Outstanding Balance
$192,823
Interest Rate
6.79%
Mortgage Type
New Conventional
Estimated Equity
$32
Purchase Details
Closed on
Oct 24, 2024
Sold by
Brumfield Jacob and Brumfield Ashley
Bought by
Day Tony
Home Financials for this Owner
Home Financials are based on the most recent Mortgage that was taken out on this home.
Original Mortgage
$194,352
Outstanding Balance
$192,823
Interest Rate
6.79%
Mortgage Type
New Conventional
Estimated Equity
$32
Create a Home Valuation Report for This Property
The Home Valuation Report is an in-depth analysis detailing your home's value as well as a comparison with similar homes in the area
Home Values in the Area
Average Home Value in this Area
Purchase History
| Date | Buyer | Sale Price | Title Company |
|---|---|---|---|
| Cx2 Investments Llc | $170,000 | None Listed On Document | |
| Cx2 Investments Llc | $170,000 | None Listed On Document | |
| Cx2 Investments Llc | $170,000 | None Listed On Document | |
| Day Tony | $280,000 | None Listed On Document | |
| Day Tony | $280,000 | None Listed On Document |
Source: Public Records
Mortgage History
| Date | Status | Borrower | Loan Amount |
|---|---|---|---|
| Open | Cx2 Investments Llc | $194,352 | |
| Closed | Cx2 Investments Llc | $194,352 |
Source: Public Records
Tax History Compared to Growth
Tax History
| Year | Tax Paid | Tax Assessment Tax Assessment Total Assessment is a certain percentage of the fair market value that is determined by local assessors to be the total taxable value of land and additions on the property. | Land | Improvement |
|---|---|---|---|---|
| 2024 | $1,117 | $106,200 | $25,000 | $81,200 |
| 2023 | $1,128 | $106,200 | $25,000 | $81,200 |
| 2022 | $158 | $85,000 | $20,000 | $65,000 |
| 2021 | $158 | $85,000 | $20,000 | $65,000 |
| 2020 | $158 | $85,000 | $20,000 | $65,000 |
| 2019 | $158 | $85,000 | $20,000 | $65,000 |
| 2018 | $158 | $85,000 | $20,000 | $65,000 |
| 2017 | $158 | $85,000 | $20,000 | $65,000 |
| 2016 | $857 | $85,000 | $20,000 | $65,000 |
| 2015 | $857 | $85,000 | $20,000 | $65,000 |
| 2014 | $842 | $85,000 | $20,000 | $65,000 |
Source: Public Records
Map
Nearby Homes
- 272 Gainesville Dr
- 264 Biloxi Dr
- 1370 Shun Pike
- 292 Kimberly Heights Dr
- 264 Grinder Ct Unit 270
- 6145 Grey Oak Ln
- 224 Vicksburg Dr
- 233 Savannah Dr Unit 2A
- 210-216 Grinder Ct
- 190-196 Grinder Ct
- 435 Edgewood Dr
- 213 Kimberly Heights Dr
- 114-116 Whaley Ct
- 900 Pinoak Dr
- 300 Morgan Leigh Ln
- 407 Morgan Leigh Ln
- 100 Makayla Trail
- Charleston Plan at Halfhill Estates
- Scarlet Oak I Plan at Halfhill Estates
- Brunty Plan at Halfhill Estates