Estimated Value: $272,000 - $285,000
2
Beds
2
Baths
1,156
Sq Ft
$243/Sq Ft
Est. Value
About This Home
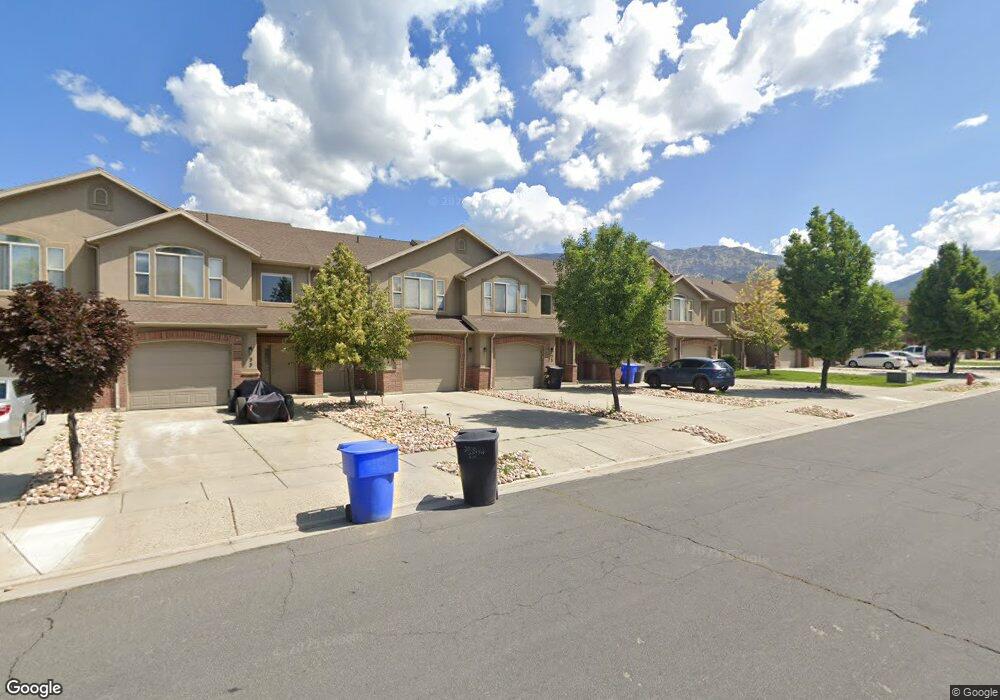
This home is located at 273 E 2300 N, Ogden, UT 84414 and is currently estimated at $280,458, approximately $242 per square foot. 273 E 2300 N is a home located in Weber County with nearby schools including North Ogden School, North Ogden Junior High School, and Weber High School.
Ownership History
Date
Name
Owned For
Owner Type
Purchase Details
Closed on
Oct 8, 2018
Sold by
Park Natalie A
Bought by
Jacobsen Jade L
Current Estimated Value
Home Financials for this Owner
Home Financials are based on the most recent Mortgage that was taken out on this home.
Original Mortgage
$162,993
Outstanding Balance
$143,563
Interest Rate
4.98%
Mortgage Type
FHA
Estimated Equity
$136,895
Purchase Details
Closed on
Dec 8, 1998
Sold by
Park Natalie A
Bought by
Park Natalie A and Park Curtis J
Home Financials for this Owner
Home Financials are based on the most recent Mortgage that was taken out on this home.
Original Mortgage
$75,924
Interest Rate
6.78%
Purchase Details
Closed on
Nov 24, 1998
Sold by
Blackhawk Condominium Real Estate Llc
Bought by
Park Natalie A
Home Financials for this Owner
Home Financials are based on the most recent Mortgage that was taken out on this home.
Original Mortgage
$75,924
Interest Rate
6.78%
Create a Home Valuation Report for This Property
The Home Valuation Report is an in-depth analysis detailing your home's value as well as a comparison with similar homes in the area
Home Values in the Area
Average Home Value in this Area
Purchase History
| Date | Buyer | Sale Price | Title Company |
|---|---|---|---|
| Jacobsen Jade L | -- | North Amer Ttl Ut Bountiful | |
| Park Natalie A | -- | -- | |
| Park Natalie A | -- | Bonneville Title |
Source: Public Records
Mortgage History
| Date | Status | Borrower | Loan Amount |
|---|---|---|---|
| Open | Jacobsen Jade L | $162,993 | |
| Previous Owner | Park Natalie A | $75,924 |
Source: Public Records
Tax History
| Year | Tax Paid | Tax Assessment Tax Assessment Total Assessment is a certain percentage of the fair market value that is determined by local assessors to be the total taxable value of land and additions on the property. | Land | Improvement |
|---|---|---|---|---|
| 2025 | $2,034 | $295,319 | $75,000 | $220,319 |
| 2024 | $1,802 | $160,049 | $41,250 | $118,799 |
| 2023 | $1,780 | $160,050 | $41,250 | $118,800 |
| 2022 | $1,736 | $160,049 | $41,250 | $118,799 |
| 2021 | $1,310 | $207,000 | $45,000 | $162,000 |
| 2020 | $1,217 | $180,000 | $25,000 | $155,000 |
| 2019 | $1,076 | $153,000 | $25,000 | $128,000 |
| 2018 | $1,007 | $137,000 | $19,000 | $118,000 |
| 2017 | $896 | $115,000 | $19,000 | $96,000 |
| 2016 | $757 | $52,250 | $8,250 | $44,000 |
| 2015 | $732 | $50,050 | $8,250 | $41,800 |
| 2014 | $730 | $48,950 | $8,250 | $40,700 |
Source: Public Records
Map
Nearby Homes
- 225 E 2300 N
- 2243 N 225 E Unit 64
- 2421 N 400 E Unit C4
- 2421 N 400 E Unit R3
- 2421 N 400 E Unit A6
- 2421 N 400 E Unit D4
- 363 E 2300 N
- 215 E Montgomery Ln
- 325 E 2550 N Unit 23
- 325 E 2550 N Unit 17
- 325 E 2550 N Unit 97
- 325 E 2550 N Unit 22
- 185 E 2100 N
- 2277 N 515 E
- 2464 Charleston Ave
- 2437 Charleston Ave
- 2213 N 525 E
- 422 E 2050 N Unit 4C
- 422 E 2050 N Unit 5C
- 133 Arlington Way
- 275 E 2300 N
- 277 E 2300 N
- 279 E 2300 N
- 283 E 2300 N Unit 32
- 285 E 2300 N
- 269 E 2300 N
- 270 E 2275 N Unit 36
- 270 E 2275 N Unit 35
- 270 E 2275 N Unit 34
- 270 E 2275 N Unit 33
- 270 E 2275 N Unit 32
- 270 E 2275 N Unit 31
- 270 E 2275 N
- 287 E 2300 N Unit 30
- 287 E 2300 N
- 267 E 2300 N Unit 38
- 247 E 2300 N Unit 46
- 245 E 2300 N Unit 47
- 243 E 2300 N Unit 48
- 249 E 2300 N
Your Personal Tour Guide
Ask me questions while you tour the home.