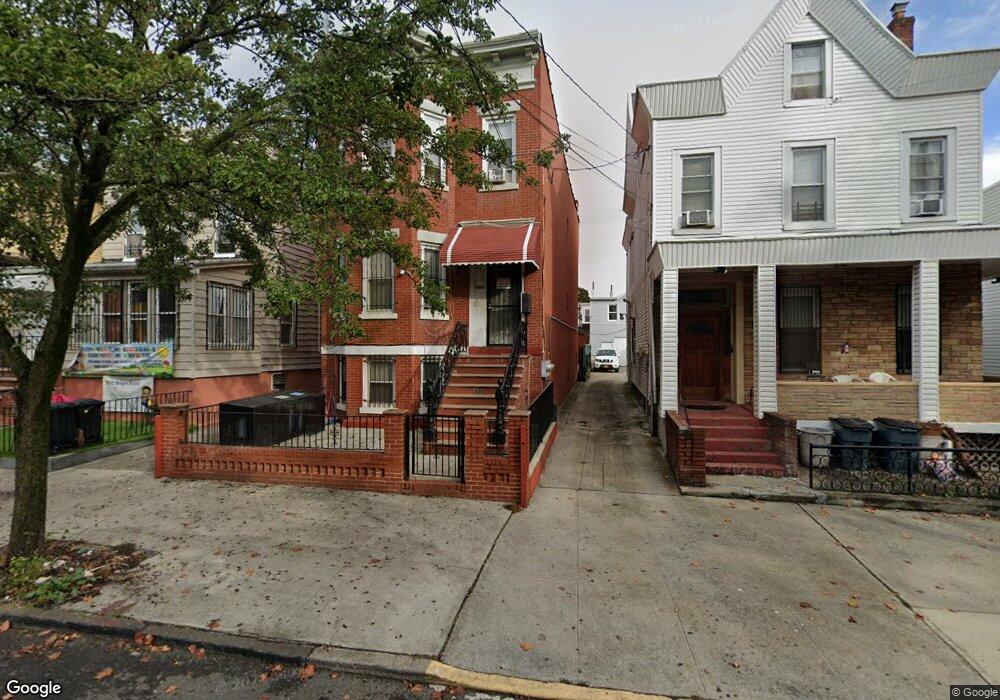
273 Etna St Brooklyn, NY 11208
Cypress Hills NeighborhoodEstimated Value: $958,000 - $1,031,000
--
Bed
--
Bath
3,120
Sq Ft
$322/Sq Ft
Est. Value
About This Home
This home is located at 273 Etna St, Brooklyn, NY 11208 and is currently estimated at $1,004,000, approximately $321 per square foot. 273 Etna St is a home located in Kings County with nearby schools including Earl Boyles Elementary School, P.S. 65, and Westridge Elementary School.
Ownership History
Date
Name
Owned For
Owner Type
Purchase Details
Closed on
Oct 1, 2018
Sold by
Etna Street Corp
Bought by
273 Etna Street Corp
Current Estimated Value
Purchase Details
Closed on
Jan 11, 2017
Sold by
Martinez Claudia
Bought by
273 Etna Street Corp
Purchase Details
Closed on
Jun 15, 2000
Sold by
Bermudez Oscar I
Bought by
Martinez Claudia
Purchase Details
Closed on
Feb 22, 1999
Sold by
Viva Development Corp
Bought by
Martinez Claudia and Bermudez Oscar I
Home Financials for this Owner
Home Financials are based on the most recent Mortgage that was taken out on this home.
Original Mortgage
$242,950
Interest Rate
7.49%
Mortgage Type
FHA
Purchase Details
Closed on
Dec 15, 1998
Sold by
Downing Robert
Bought by
Viva Development Corp
Create a Home Valuation Report for This Property
The Home Valuation Report is an in-depth analysis detailing your home's value as well as a comparison with similar homes in the area
Home Values in the Area
Average Home Value in this Area
Purchase History
| Date | Buyer | Sale Price | Title Company |
|---|---|---|---|
| 273 Etna Street Corp | -- | -- | |
| 273 Etna Street Corp | -- | -- | |
| Martinez Claudia | -- | Chicago Title Insurance Co | |
| Martinez Claudia | $245,000 | -- | |
| Viva Development Corp | $60,000 | Stewart Title Insurance Co |
Source: Public Records
Mortgage History
| Date | Status | Borrower | Loan Amount |
|---|---|---|---|
| Previous Owner | Martinez Claudia | $242,950 |
Source: Public Records
Tax History Compared to Growth
Tax History
| Year | Tax Paid | Tax Assessment Tax Assessment Total Assessment is a certain percentage of the fair market value that is determined by local assessors to be the total taxable value of land and additions on the property. | Land | Improvement |
|---|---|---|---|---|
| 2025 | $5,497 | $61,020 | $20,820 | $40,200 |
| 2024 | $5,497 | $60,300 | $20,820 | $39,480 |
| 2023 | $5,231 | $56,640 | $20,820 | $35,820 |
| 2022 | $4,834 | $58,920 | $20,820 | $38,100 |
| 2021 | $4,801 | $54,240 | $20,820 | $33,420 |
| 2020 | $3,601 | $45,240 | $20,820 | $24,420 |
| 2019 | $4,723 | $45,240 | $20,820 | $24,420 |
| 2018 | $4,316 | $22,632 | $7,775 | $14,857 |
| 2017 | $4,058 | $21,378 | $9,136 | $12,242 |
| 2016 | $3,725 | $20,182 | $9,740 | $10,442 |
| 2015 | $2,213 | $20,178 | $12,758 | $7,420 |
| 2014 | $2,213 | $19,980 | $13,743 | $6,237 |
Source: Public Records
Map
Nearby Homes