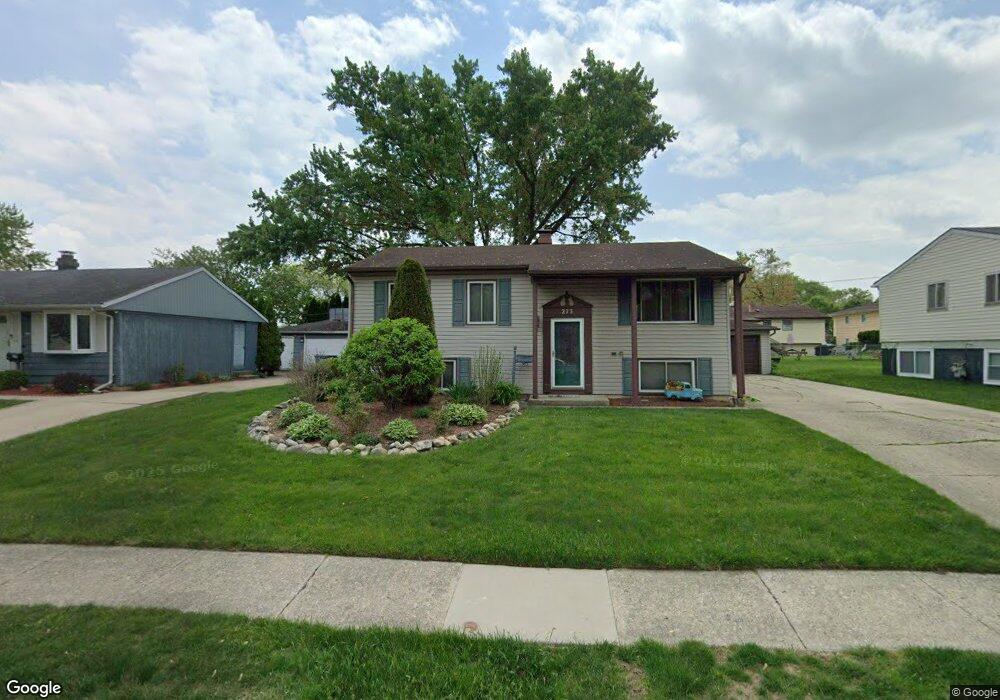
273 Mark Ave Glendale Heights, IL 60139
Estimated Value: $297,000 - $346,000
4
Beds
2
Baths
1,934
Sq Ft
$169/Sq Ft
Est. Value
About This Home
This home is located at 273 Mark Ave, Glendale Heights, IL 60139 and is currently estimated at $326,622, approximately $168 per square foot. 273 Mark Ave is a home located in DuPage County with nearby schools including Glen Hill Primary School, Americana Intermediate School, and Glenside Middle School.
Ownership History
Date
Name
Owned For
Owner Type
Purchase Details
Closed on
Feb 26, 2013
Sold by
Austin Brett D and Smith Patricia A
Bought by
Austin Brett D and Austin Patricia A
Current Estimated Value
Home Financials for this Owner
Home Financials are based on the most recent Mortgage that was taken out on this home.
Original Mortgage
$145,000
Outstanding Balance
$102,693
Interest Rate
3.62%
Mortgage Type
New Conventional
Estimated Equity
$223,929
Purchase Details
Closed on
Apr 21, 2000
Sold by
Smith Merridee and Esquivias Merridee J
Bought by
Austin Brett D and Smith Patricia A
Home Financials for this Owner
Home Financials are based on the most recent Mortgage that was taken out on this home.
Original Mortgage
$143,450
Interest Rate
8.26%
Purchase Details
Closed on
Sep 25, 1997
Sold by
Esquivias Luis
Bought by
Esquivias Merridee J
Purchase Details
Closed on
Nov 30, 1995
Sold by
Rinaldi Kathleen M
Bought by
Esquivias Luis and Esquivias Merridee J
Home Financials for this Owner
Home Financials are based on the most recent Mortgage that was taken out on this home.
Original Mortgage
$100,000
Interest Rate
7.44%
Create a Home Valuation Report for This Property
The Home Valuation Report is an in-depth analysis detailing your home's value as well as a comparison with similar homes in the area
Home Values in the Area
Average Home Value in this Area
Purchase History
| Date | Buyer | Sale Price | Title Company |
|---|---|---|---|
| Austin Brett D | -- | Primary Title Services Llc | |
| Austin Brett D | $151,000 | First American Title | |
| Esquivias Merridee J | -- | -- | |
| Esquivias Luis | $121,000 | -- |
Source: Public Records
Mortgage History
| Date | Status | Borrower | Loan Amount |
|---|---|---|---|
| Open | Austin Brett D | $145,000 | |
| Closed | Austin Brett D | $143,450 | |
| Closed | Esquivias Luis | $100,000 |
Source: Public Records
Tax History
| Year | Tax Paid | Tax Assessment Tax Assessment Total Assessment is a certain percentage of the fair market value that is determined by local assessors to be the total taxable value of land and additions on the property. | Land | Improvement |
|---|---|---|---|---|
| 2024 | $7,982 | $95,244 | $26,102 | $69,142 |
| 2023 | $7,702 | $87,100 | $23,870 | $63,230 |
| 2022 | $7,398 | $79,730 | $21,170 | $58,560 |
| 2021 | $6,997 | $75,750 | $20,110 | $55,640 |
| 2020 | $6,733 | $73,900 | $19,620 | $54,280 |
| 2019 | $6,517 | $71,010 | $18,850 | $52,160 |
| 2018 | $5,961 | $59,000 | $18,360 | $40,640 |
| 2017 | $5,775 | $54,690 | $17,020 | $37,670 |
| 2016 | $5,545 | $50,610 | $15,750 | $34,860 |
| 2015 | $5,419 | $47,120 | $14,700 | $32,420 |
| 2014 | $5,263 | $45,590 | $13,170 | $32,420 |
| 2013 | $5,199 | $47,150 | $13,620 | $33,530 |
Source: Public Records
Map
Nearby Homes
- 2N643 Diane Ave
- 2N631 Virginia Ave
- 215 E Lincoln Ave
- 156 E Fullerton Ave
- 260 Paddock Cir
- 200 Ahmed Ct
- 424 Mark Ave
- 364 Polo Club Dr Unit 2
- 2N417 Amy Ave
- 1772 Frank Ct
- 1595 Ardmore Ave
- 1651 Ardmore Ave
- 2N356 Prairie Ave
- 2N309 Pearl Ave
- 1515 Highland Ave
- 118 Windsor Ln
- 1688 President St
- 33 Opal Ave
- 71 Cambridge Ln
- 1905 Basswood Ln
Your Personal Tour Guide
Ask me questions while you tour the home.