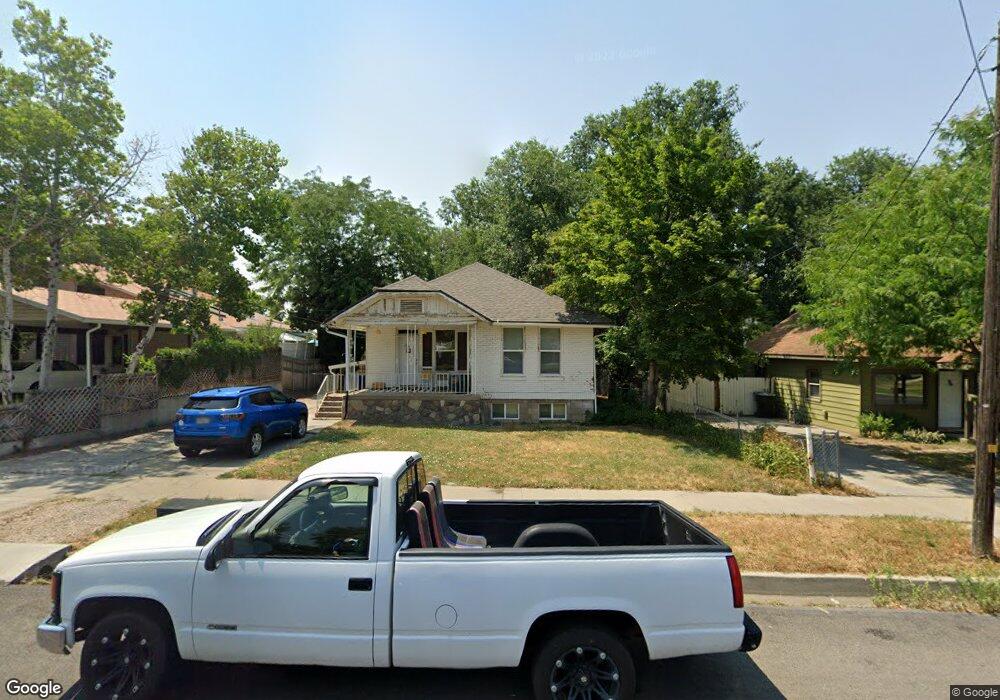
273 N 200 W Tooele, UT 84074
Estimated Value: $342,000 - $436,000
5
Beds
2
Baths
2,864
Sq Ft
$135/Sq Ft
Est. Value
About This Home
This home is located at 273 N 200 W, Tooele, UT 84074 and is currently estimated at $387,323, approximately $135 per square foot. 273 N 200 W is a home located in Tooele County with nearby schools including Northlake Elementary School, Tooele Junior High School, and Tooele High School.
Ownership History
Date
Name
Owned For
Owner Type
Purchase Details
Closed on
Jun 2, 2020
Sold by
Jensen Travis Scott
Bought by
Jensen Travis Scott and Christensen Suzanne
Current Estimated Value
Home Financials for this Owner
Home Financials are based on the most recent Mortgage that was taken out on this home.
Original Mortgage
$150,500
Outstanding Balance
$133,655
Interest Rate
3.3%
Mortgage Type
New Conventional
Estimated Equity
$253,668
Purchase Details
Closed on
Jan 27, 2017
Sold by
Jensen Travis and Ekins Sharon
Bought by
Jensen Travis Scott
Home Financials for this Owner
Home Financials are based on the most recent Mortgage that was taken out on this home.
Original Mortgage
$150,590
Interest Rate
4.37%
Mortgage Type
FHA
Purchase Details
Closed on
Aug 28, 2015
Sold by
Kidwell Linda M
Bought by
Jensen Travis and Ekins Sharon
Home Financials for this Owner
Home Financials are based on the most recent Mortgage that was taken out on this home.
Original Mortgage
$97,730
Interest Rate
3.87%
Mortgage Type
FHA
Create a Home Valuation Report for This Property
The Home Valuation Report is an in-depth analysis detailing your home's value as well as a comparison with similar homes in the area
Home Values in the Area
Average Home Value in this Area
Purchase History
| Date | Buyer | Sale Price | Title Company |
|---|---|---|---|
| Jensen Travis Scott | -- | Us Title Insurance Agency | |
| Jensen Travis Scott | -- | Inwest Title Tooele Office | |
| Jensen Travis | -- | Inwest Title |
Source: Public Records
Mortgage History
| Date | Status | Borrower | Loan Amount |
|---|---|---|---|
| Open | Jensen Travis Scott | $150,500 | |
| Closed | Jensen Travis Scott | $150,590 | |
| Closed | Jensen Travis | $97,730 |
Source: Public Records
Tax History Compared to Growth
Tax History
| Year | Tax Paid | Tax Assessment Tax Assessment Total Assessment is a certain percentage of the fair market value that is determined by local assessors to be the total taxable value of land and additions on the property. | Land | Improvement |
|---|---|---|---|---|
| 2025 | $1,994 | $166,344 | $61,188 | $105,156 |
| 2024 | $2,211 | $168,737 | $61,188 | $107,549 |
| 2023 | $2,211 | $143,141 | $58,262 | $84,879 |
| 2022 | $2,265 | $194,887 | $70,813 | $124,074 |
| 2021 | $2,133 | $153,494 | $23,547 | $129,947 |
| 2020 | $2,018 | $251,899 | $42,813 | $209,086 |
| 2019 | $1,829 | $224,627 | $42,813 | $181,814 |
| 2018 | $1,744 | $203,099 | $45,000 | $158,099 |
| 2017 | $1,245 | $172,063 | $32,188 | $139,875 |
| 2016 | $1,032 | $84,600 | $17,703 | $66,897 |
| 2015 | $1,032 | $75,087 | $0 | $0 |
| 2014 | -- | $75,087 | $0 | $0 |
Source: Public Records
Map
Nearby Homes
- 307 N 200 W
- 225 230 N
- 225 N 200 W
- 180 W Utah Ave
- 138 W Utah Ave
- 165 N 200 W
- 152 N 200 W
- 370 N 100 W
- 416 N 340 W
- 524 N 200 W
- 16 N 100 W
- 107 W 600 N Unit 204
- 352 W 600 N Unit 44
- 362 W 600 N Unit 43
- 372 W 600 N Unit 42
- 81 S 100 W
- 453 W Vine St
- 363 W 630 North St Unit 20
- 353 W 630 N Unit 19
- Snowbird Plan at Vista Meadows