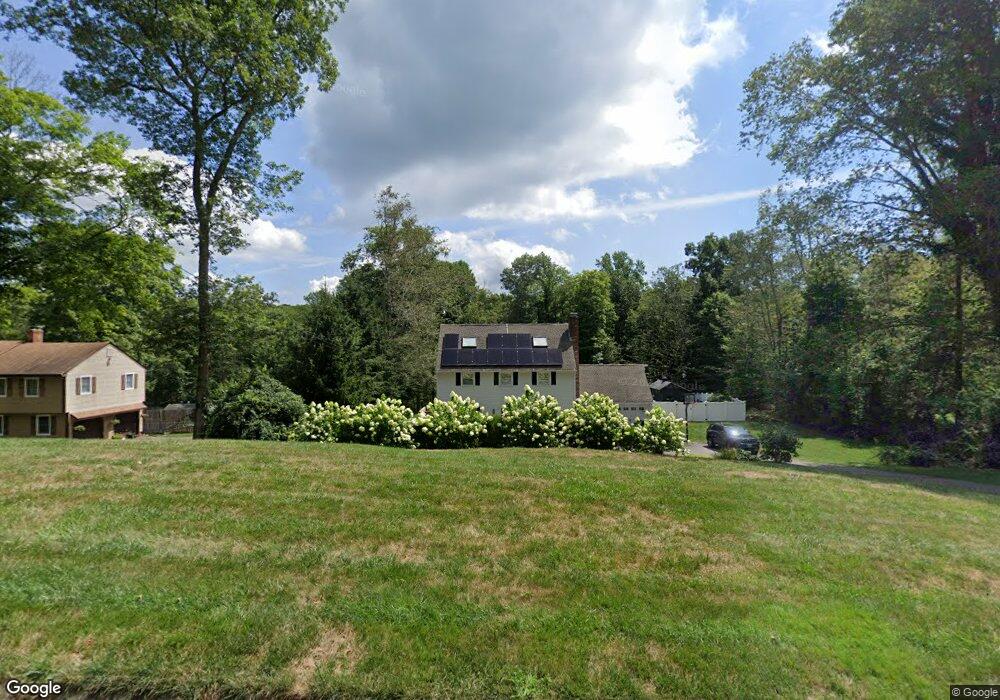
273 Northwood Dr Guilford, CT 06437
Estimated Value: $583,659 - $724,000
4
Beds
3
Baths
2,066
Sq Ft
$311/Sq Ft
Est. Value
About This Home
This home is located at 273 Northwood Dr, Guilford, CT 06437 and is currently estimated at $642,415, approximately $310 per square foot. 273 Northwood Dr is a home located in New Haven County with nearby schools including A. Baldwin Middle School, E.C. Adams Middle School, and Guilford High School.
Ownership History
Date
Name
Owned For
Owner Type
Purchase Details
Closed on
Jul 22, 2011
Sold by
Rm Dev Group Llc
Bought by
Corso Philip and Corso Marisa
Current Estimated Value
Home Financials for this Owner
Home Financials are based on the most recent Mortgage that was taken out on this home.
Original Mortgage
$353,400
Outstanding Balance
$242,019
Interest Rate
4.49%
Estimated Equity
$400,396
Purchase Details
Closed on
Nov 8, 2010
Sold by
Rak Steven and Rak John
Bought by
Rm Dev Group Llc
Purchase Details
Closed on
Apr 29, 2003
Sold by
Oh Albert S and Oh Dawn G
Bought by
Profeto-Irwin Mary
Purchase Details
Closed on
May 28, 1999
Sold by
Brown Mitchell and Brown Lisa
Bought by
Oh Albert S and Oh Dawn G
Purchase Details
Closed on
Dec 8, 1997
Sold by
Goldberg Cynthia C
Bought by
Brown Mitchell and Brown Lisa
Create a Home Valuation Report for This Property
The Home Valuation Report is an in-depth analysis detailing your home's value as well as a comparison with similar homes in the area
Home Values in the Area
Average Home Value in this Area
Purchase History
| Date | Buyer | Sale Price | Title Company |
|---|---|---|---|
| Corso Philip | $372,000 | -- | |
| Rm Dev Group Llc | -- | -- | |
| Rak Stephen | $188,000 | -- | |
| Profeto-Irwin Mary | $350,000 | -- | |
| Oh Albert S | $236,500 | -- | |
| Brown Mitchell | $198,000 | -- |
Source: Public Records
Mortgage History
| Date | Status | Borrower | Loan Amount |
|---|---|---|---|
| Open | Brown Mitchell | $353,400 | |
| Previous Owner | Brown Mitchell | $415,650 |
Source: Public Records
Tax History Compared to Growth
Tax History
| Year | Tax Paid | Tax Assessment Tax Assessment Total Assessment is a certain percentage of the fair market value that is determined by local assessors to be the total taxable value of land and additions on the property. | Land | Improvement |
|---|---|---|---|---|
| 2025 | $8,646 | $312,690 | $147,000 | $165,690 |
| 2024 | $8,311 | $312,690 | $147,000 | $165,690 |
| 2023 | $8,092 | $312,690 | $147,000 | $165,690 |
| 2022 | $8,145 | $244,950 | $133,000 | $111,950 |
| 2021 | $7,990 | $244,950 | $133,000 | $111,950 |
| 2020 | $7,914 | $244,950 | $133,000 | $111,950 |
| 2019 | $7,846 | $244,950 | $133,000 | $111,950 |
| 2018 | $7,662 | $244,950 | $133,000 | $111,950 |
| 2017 | $7,776 | $264,840 | $138,600 | $126,240 |
| 2016 | $7,593 | $264,840 | $138,600 | $126,240 |
| 2015 | $7,479 | $264,840 | $138,600 | $126,240 |
| 2014 | $7,262 | $264,840 | $138,600 | $126,240 |
Source: Public Records
Map
Nearby Homes
- 747 Route 80
- 75 Hart Rd
- 7 Hart Rd
- 259 Weatherly Trail
- 95 Joseph Dr
- 148 Country Way
- 0 Tamarack Ln Unit Lot 23 24071362
- 0 Tamarack Ln Unit Lot 19 24071360
- 154 Wilburs Ln
- 90 Cedar Hill Rd
- 448 Lake Dr
- 79 Fall Rd
- 24 Echo Point Rd
- 2064 Long Hill Rd
- 542 Lake Dr
- 1092 Durham Rd
- 817 Lake Dr
- 65 Ironwood Rd
- 874 Nut Plains Rd Unit Lot 2 - Style A
- 76 Squires Rd
- 291 Northwood Dr
- 257 Northwood Dr
- 303 Northwood Dr
- 239 Northwood Dr
- 87 Stone Boat Rd
- 266 Northwood Dr
- 319 Northwood Dr
- 288 Northwood Dr
- 240 Northwood Dr
- 320 Northwood Dr
- 232 Northwood Dr
- 85 Stone Boat Rd
- 91 Stone Boat Rd
- 364 Northwood Dr
- 123 Stone Boat Rd
- 382 Northwood Dr
- 202 Northwood Dr
- 77 Stone Boat Rd
- 394 Northwood Dr
- 51 Barnshed Ln