273 Pierson Rd Sequim, WA 98382
Estimated Value: $404,000 - $566,697
2
Beds
1
Bath
966
Sq Ft
$502/Sq Ft
Est. Value
About This Home
This home is located at 273 Pierson Rd, Sequim, WA 98382 and is currently estimated at $485,349, approximately $502 per square foot. 273 Pierson Rd is a home located in Clallam County with nearby schools including Greywolf Elementary School, Sequim Middle School, and Sequim Senior High School.
Ownership History
Date
Name
Owned For
Owner Type
Purchase Details
Closed on
May 11, 2016
Sold by
Dare Crystal K
Bought by
Billings Gregory F
Current Estimated Value
Purchase Details
Closed on
Oct 20, 2008
Sold by
Dare Crystal K and Billings Gregory F
Bought by
Billings Gregory F and Dale Crystal K
Home Financials for this Owner
Home Financials are based on the most recent Mortgage that was taken out on this home.
Original Mortgage
$370,005
Interest Rate
5.9%
Mortgage Type
FHA
Purchase Details
Closed on
Dec 2, 2005
Sold by
Peterson Wesley D
Bought by
Dare Crystal K and Billings Gregory F
Home Financials for this Owner
Home Financials are based on the most recent Mortgage that was taken out on this home.
Original Mortgage
$138,500
Interest Rate
6.14%
Mortgage Type
New Conventional
Create a Home Valuation Report for This Property
The Home Valuation Report is an in-depth analysis detailing your home's value as well as a comparison with similar homes in the area
Purchase History
| Date | Buyer | Sale Price | Title Company |
|---|---|---|---|
| Billings Gregory F | -- | None Available | |
| Billings Gregory F | -- | Clallam Title Co | |
| Dare Crystal K | $155,000 | Clallam Title Co |
Source: Public Records
Mortgage History
| Date | Status | Borrower | Loan Amount |
|---|---|---|---|
| Previous Owner | Billings Gregory F | $370,005 | |
| Previous Owner | Dare Crystal K | $138,500 |
Source: Public Records
Tax History
| Year | Tax Paid | Tax Assessment Tax Assessment Total Assessment is a certain percentage of the fair market value that is determined by local assessors to be the total taxable value of land and additions on the property. | Land | Improvement |
|---|---|---|---|---|
| 2025 | $3,605 | $453,916 | $135,052 | $318,864 |
| 2023 | $3,605 | $465,869 | $122,634 | $343,235 |
| 2022 | $3,631 | $441,031 | $97,796 | $343,235 |
| 2021 | $3,412 | $382,407 | $81,497 | $300,910 |
| 2020 | $3,508 | $326,517 | $77,616 | $248,901 |
| 2018 | $2,941 | $294,940 | $77,616 | $217,324 |
| 2017 | $2,489 | $250,074 | $77,616 | $172,458 |
| 2016 | $2,323 | $250,512 | $77,616 | $172,896 |
| 2015 | $2,323 | $214,832 | $86,240 | $128,592 |
| 2013 | $2,323 | $208,402 | $86,240 | $122,162 |
| 2012 | $2,323 | $219,624 | $91,032 | $128,592 |
Source: Public Records
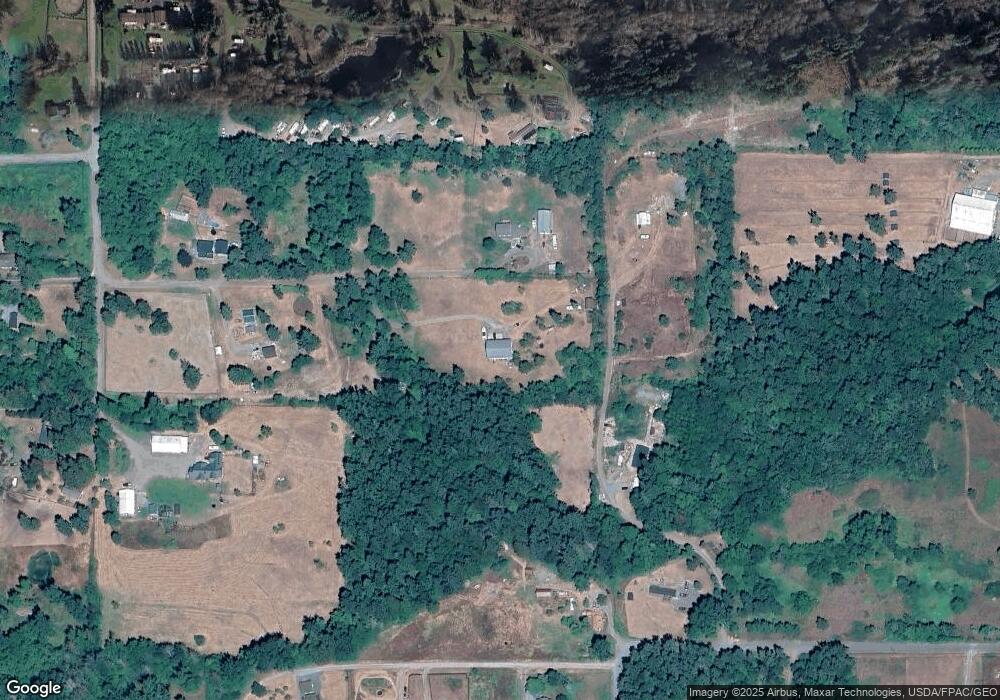
Map
Nearby Homes
- 883 N Rock Rose Ave
- 402 Parrish Rd
- 59 NKA Parrish Rd
- 0 Parrish Rd
- 111 Dryke Rd Unit 22
- 111 Dryke Rd
- 10 Davenhill Ln
- 341 Sherburne Rd
- 642 Kitchen Dick Rd
- 196 N Solmar Dr
- 153 Davidson Dr
- 180 Le Roux Rd
- 114 Harmony Ln
- 211 S Barr Rd
- 505 N Barr Rd
- 999 Spath Rd
- 171 Moonshadow Ln
- 153 Moonshadow Ln
- 143 Moonshadow Ln
- 379 Dorothy Hunt Ln Unit Parcel B
- 279 Pierson Rd
- 59 Parrish Rd
- 277 Pierson Rd
- 11 Parrish Rd
- 00000 Tripp Rd
- 275 Pierson Rd
- ~ Parrish Rd
- 343 Pierson Rd
- 00 Parrish Rd
- 151 Some Day Way
- 41 Some Day Way
- 131 Pierson Rd
- 259796 Highway 101
- 53 Pierson Ln
- 53 Pierson Ln
- 9999 E Hwy 101
- 9999 E Highway 101 E
- 9999 U S 101
- 9999 E Hwy 101 Unit east Blue Mt
Your Personal Tour Guide
Ask me questions while you tour the home.