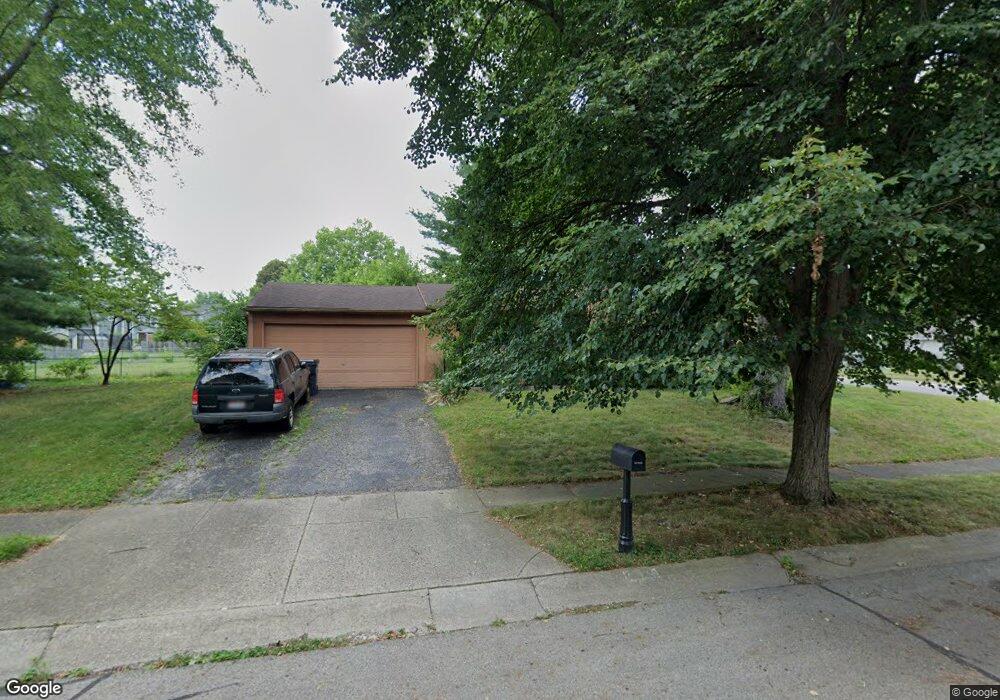
273 Redmond Way Columbus, OH 43230
Woodside Green NeighborhoodEstimated Value: $312,000 - $360,000
3
Beds
3
Baths
1,570
Sq Ft
$213/Sq Ft
Est. Value
About This Home
This home is located at 273 Redmond Way, Columbus, OH 43230 and is currently estimated at $333,688, approximately $212 per square foot. 273 Redmond Way is a home located in Franklin County with nearby schools including Chapelfield Elementary School, Gahanna West Middle School, and Lincoln High School.
Ownership History
Date
Name
Owned For
Owner Type
Purchase Details
Closed on
Nov 14, 2007
Sold by
Bullock Brian J and Bullock Kecia M
Bought by
Bullock Brian J and Bullock Kecia M
Current Estimated Value
Home Financials for this Owner
Home Financials are based on the most recent Mortgage that was taken out on this home.
Original Mortgage
$38,491
Outstanding Balance
$24,466
Interest Rate
6.47%
Mortgage Type
Stand Alone Second
Estimated Equity
$309,222
Purchase Details
Closed on
Apr 30, 1999
Sold by
Rotter Dorothy L and Estate Of Carl W Rotter
Bought by
Bullock Brian J and Costello Kecia M
Home Financials for this Owner
Home Financials are based on the most recent Mortgage that was taken out on this home.
Original Mortgage
$109,250
Outstanding Balance
$28,228
Interest Rate
7.04%
Estimated Equity
$305,460
Purchase Details
Closed on
Mar 6, 1987
Bought by
Rotter Dorothy L
Purchase Details
Closed on
Dec 1, 1983
Purchase Details
Closed on
Sep 1, 1983
Create a Home Valuation Report for This Property
The Home Valuation Report is an in-depth analysis detailing your home's value as well as a comparison with similar homes in the area
Home Values in the Area
Average Home Value in this Area
Purchase History
| Date | Buyer | Sale Price | Title Company |
|---|---|---|---|
| Bullock Brian J | -- | Services L | |
| Bullock Brian J | $57,500 | -- | |
| Bullock Brian J | $57,500 | -- | |
| Rotter Dorothy L | -- | -- | |
| -- | $59,100 | -- | |
| -- | -- | -- |
Source: Public Records
Mortgage History
| Date | Status | Borrower | Loan Amount |
|---|---|---|---|
| Open | Bullock Brian J | $38,491 | |
| Open | Bullock Brian J | $109,250 |
Source: Public Records
Tax History Compared to Growth
Tax History
| Year | Tax Paid | Tax Assessment Tax Assessment Total Assessment is a certain percentage of the fair market value that is determined by local assessors to be the total taxable value of land and additions on the property. | Land | Improvement |
|---|---|---|---|---|
| 2024 | $5,531 | $93,880 | $28,320 | $65,560 |
| 2023 | $5,461 | $93,870 | $28,315 | $65,555 |
| 2022 | $5,189 | $69,480 | $14,630 | $54,850 |
| 2021 | $5,018 | $69,480 | $14,630 | $54,850 |
| 2020 | $4,976 | $69,480 | $14,630 | $54,850 |
| 2019 | $4,215 | $58,730 | $12,180 | $46,550 |
| 2018 | $3,852 | $58,730 | $12,180 | $46,550 |
| 2017 | $3,869 | $58,730 | $12,180 | $46,550 |
| 2016 | $3,517 | $48,620 | $14,700 | $33,920 |
| 2015 | $3,519 | $48,620 | $14,700 | $33,920 |
| 2014 | $3,492 | $48,620 | $14,700 | $33,920 |
| 2013 | $1,734 | $48,615 | $14,700 | $33,915 |
Source: Public Records
Map
Nearby Homes
- 402 Bluestem Ave
- 459 Bluestem Ave
- 111 Nob Hill Dr N
- 642 Ridenour Rd
- 0 Wendler Blvd
- 3544 Halpern St
- 108 Walcreek Dr W
- 536 Springwood Lake Dr
- 200 Glenhurst Ct
- 167 Greenbank Rd
- 638 Thistle Ave
- 3555 Tami Place
- 158 Windrow Ct
- 3150 Berkley Pointe Dr
- 3877 Hines Rd
- 3118 Berkley Pointe Dr
- 211 Crossing Creek N
- 3954 Stapleford Dr Unit 3954
- 3931 Maidstone Dr
- 5142 Cherryblossom Way
- 961 Ridenour Rd
- 268 Redmond Way
- 963 Ridenour Rd
- 283 Redmond Way
- 269 Camrose Ct
- 941 Ridenour Rd
- 965 Ridenour Rd
- 950 Ridenour Rd
- 285 Redmond Way
- 962 Ridenour Rd
- 261 Camrose Ct
- 250 Canby Ct
- 276 Redmond Way
- 933 Ridenour Rd
- 967 Ridenour Rd
- 284 Redmond Way
- 280 Redmond Way
- 952 Hartney Dr
- 946 Hartney Dr
- 925 Ridenour Rd