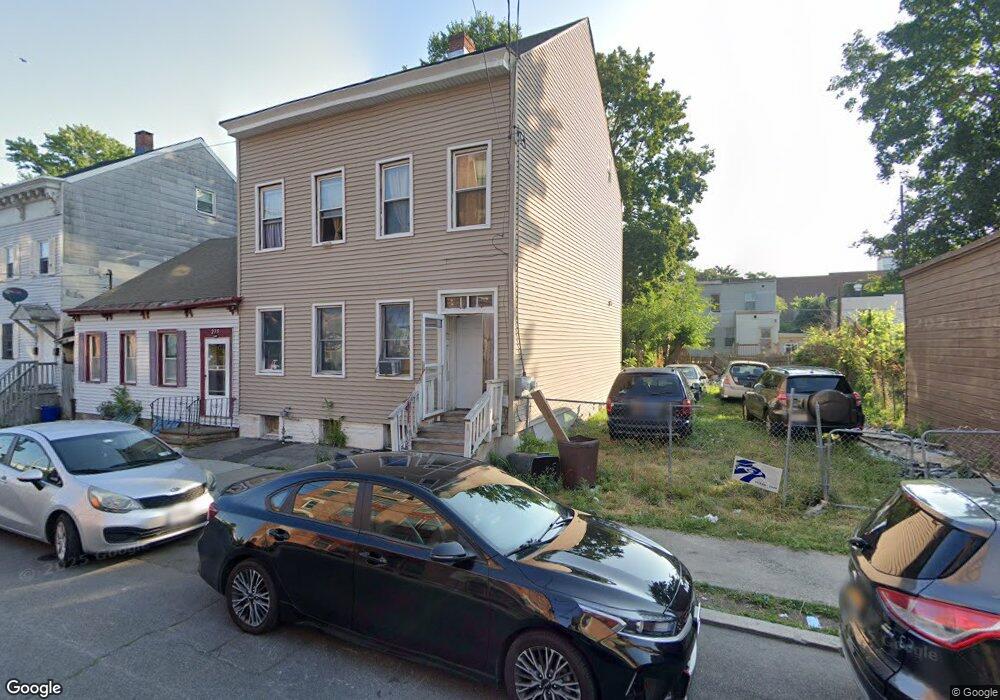
273 Sherman St Albany, NY 12206
West Hill NeighborhoodEstimated Value: $110,000 - $141,654
4
Beds
2
Baths
1,600
Sq Ft
$77/Sq Ft
Est. Value
About This Home
This home is located at 273 Sherman St, Albany, NY 12206 and is currently estimated at $123,414, approximately $77 per square foot. 273 Sherman St is a home located in Albany County with nearby schools including Stephen And Harriet Myers Middle School, Roots Academy at West Hill, and Albany High School.
Ownership History
Date
Name
Owned For
Owner Type
Purchase Details
Closed on
Aug 10, 2016
Sold by
273 Sherman Llc
Bought by
Zaw Thein
Current Estimated Value
Home Financials for this Owner
Home Financials are based on the most recent Mortgage that was taken out on this home.
Original Mortgage
$1,500
Interest Rate
3.47%
Mortgage Type
Purchase Money Mortgage
Purchase Details
Closed on
Dec 14, 2011
Sold by
Ahmed Zubair
Bought by
273 Sherman Llc
Purchase Details
Closed on
Oct 21, 2011
Sold by
Khan Faraz A
Bought by
Ahmed Zubair
Purchase Details
Closed on
May 6, 2005
Sold by
Husain Liaquat
Bought by
Khan Faraz
Create a Home Valuation Report for This Property
The Home Valuation Report is an in-depth analysis detailing your home's value as well as a comparison with similar homes in the area
Home Values in the Area
Average Home Value in this Area
Purchase History
| Date | Buyer | Sale Price | Title Company |
|---|---|---|---|
| Zaw Thein | $65,000 | None Available | |
| 273 Sherman Llc | -- | None Available | |
| Ahmed Zubair | $34,000 | None Available | |
| Khan Faraz | $30,000 | Michael Braccini |
Source: Public Records
Mortgage History
| Date | Status | Borrower | Loan Amount |
|---|---|---|---|
| Previous Owner | Zaw Thein | $1,500 |
Source: Public Records
Tax History Compared to Growth
Tax History
| Year | Tax Paid | Tax Assessment Tax Assessment Total Assessment is a certain percentage of the fair market value that is determined by local assessors to be the total taxable value of land and additions on the property. | Land | Improvement |
|---|---|---|---|---|
| 2024 | $2,451 | $89,000 | $17,800 | $71,200 |
| 2023 | $1,599 | $36,000 | $7,200 | $28,800 |
| 2022 | $1,568 | $36,000 | $7,200 | $28,800 |
| 2021 | $1,564 | $36,000 | $7,200 | $28,800 |
| 2020 | $1,366 | $36,000 | $7,200 | $28,800 |
| 2019 | $1,417 | $36,000 | $7,200 | $28,800 |
| 2018 | $2,201 | $36,000 | $7,200 | $28,800 |
| 2017 | $935 | $36,000 | $7,200 | $28,800 |
| 2016 | $1,740 | $36,000 | $7,200 | $28,800 |
| 2015 | $1,259 | $34,300 | $6,900 | $27,400 |
| 2014 | -- | $34,300 | $6,900 | $27,400 |
Source: Public Records
Map
Nearby Homes