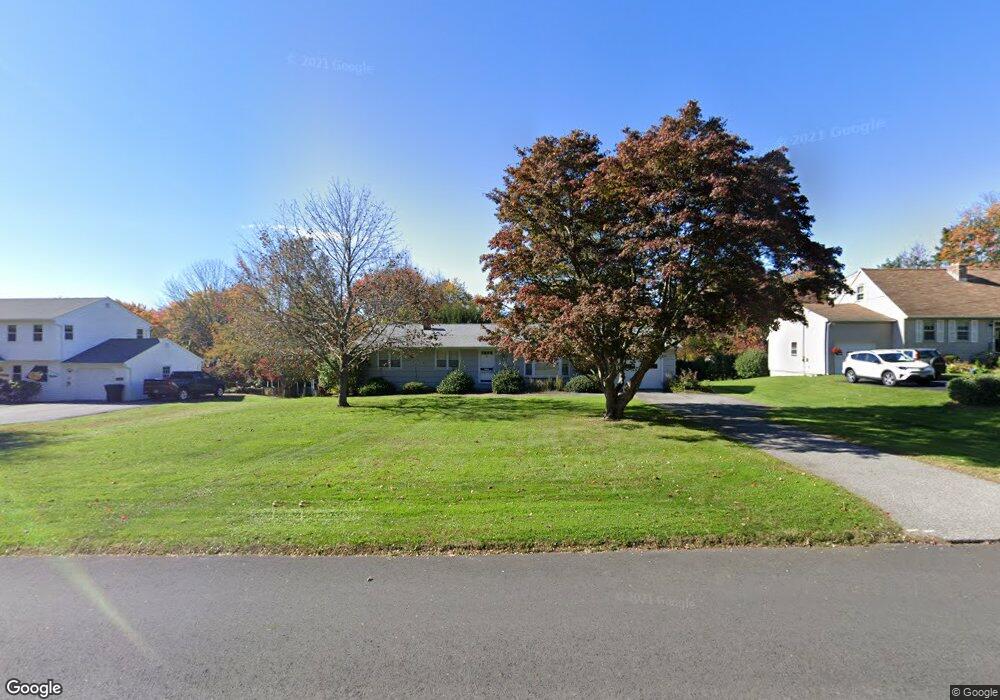
273 Torringford East St Torrington, CT 06790
Estimated Value: $302,094 - $337,000
3
Beds
2
Baths
1,274
Sq Ft
$244/Sq Ft
Est. Value
About This Home
This home is located at 273 Torringford East St, Torrington, CT 06790 and is currently estimated at $311,274, approximately $244 per square foot. 273 Torringford East St is a home located in Litchfield County with nearby schools including Torrington Middle School, Torrington High School, and Torrington Christian Academy.
Ownership History
Date
Name
Owned For
Owner Type
Purchase Details
Closed on
Jun 16, 2023
Sold by
Armata Raegan M and Nestor Ashlee B
Bought by
Roscello Robert
Current Estimated Value
Home Financials for this Owner
Home Financials are based on the most recent Mortgage that was taken out on this home.
Original Mortgage
$164,000
Outstanding Balance
$158,621
Interest Rate
5.25%
Mortgage Type
Purchase Money Mortgage
Estimated Equity
$152,653
Create a Home Valuation Report for This Property
The Home Valuation Report is an in-depth analysis detailing your home's value as well as a comparison with similar homes in the area
Home Values in the Area
Average Home Value in this Area
Purchase History
| Date | Buyer | Sale Price | Title Company |
|---|---|---|---|
| Roscello Robert | $205,000 | None Available |
Source: Public Records
Mortgage History
| Date | Status | Borrower | Loan Amount |
|---|---|---|---|
| Open | Roscello Robert | $164,000 |
Source: Public Records
Tax History Compared to Growth
Tax History
| Year | Tax Paid | Tax Assessment Tax Assessment Total Assessment is a certain percentage of the fair market value that is determined by local assessors to be the total taxable value of land and additions on the property. | Land | Improvement |
|---|---|---|---|---|
| 2025 | $6,050 | $157,360 | $20,370 | $136,990 |
| 2024 | $4,281 | $89,240 | $20,370 | $68,870 |
| 2023 | $4,280 | $89,240 | $20,370 | $68,870 |
| 2022 | $4,207 | $89,240 | $20,370 | $68,870 |
| 2021 | $4,120 | $89,240 | $20,370 | $68,870 |
| 2020 | $4,120 | $89,240 | $20,370 | $68,870 |
| 2019 | $3,683 | $79,760 | $20,370 | $59,390 |
| 2018 | $3,683 | $79,760 | $20,370 | $59,390 |
| 2017 | $3,649 | $79,760 | $20,370 | $59,390 |
| 2016 | $3,649 | $79,760 | $20,370 | $59,390 |
| 2015 | $3,649 | $79,760 | $20,370 | $59,390 |
| 2014 | $4,120 | $113,440 | $41,640 | $71,800 |
Source: Public Records
Map
Nearby Homes
- 111 Oxbow Dr
- 73 Shirley Rd
- 51 Bradford Rd
- 595 Torringford St
- 325 Circle Dr
- 410 Circle Dr
- 714 Torringford St
- 100 Nutmeg Dr
- 69 Sunrise Dr
- 175 Ramstein Rd
- 211 Lyman Dr
- 179 Greenridge Rd
- 144 Morningside Dr
- 33 Dawn Ave
- 157 Edgewood Dr
- 0 Torringford St W
- 178 Edgewood Dr
- 141 Highfield Dr
- 116 Albany St
- 29 Hannah Way
- 259 Torringford East St
- 287 Torringford East St
- 247 Torringford East St
- 451 Oxbow Dr
- 465 Oxbow Dr
- 439 Oxbow Dr
- 233 Torringford East St
- 301 Torringford East St
- 90 Muckle Rd
- 477 Oxbow Dr
- 423 Oxbow Dr
- 315 Torringford East St
- 221 Torringford East St
- 448 Oxbow Dr
- 491 Oxbow Dr
- 411 Oxbow Dr
- 329 Torringford East St
- 205 Torringford East St
- 95 Muckle Rd
- 468 Oxbow Dr