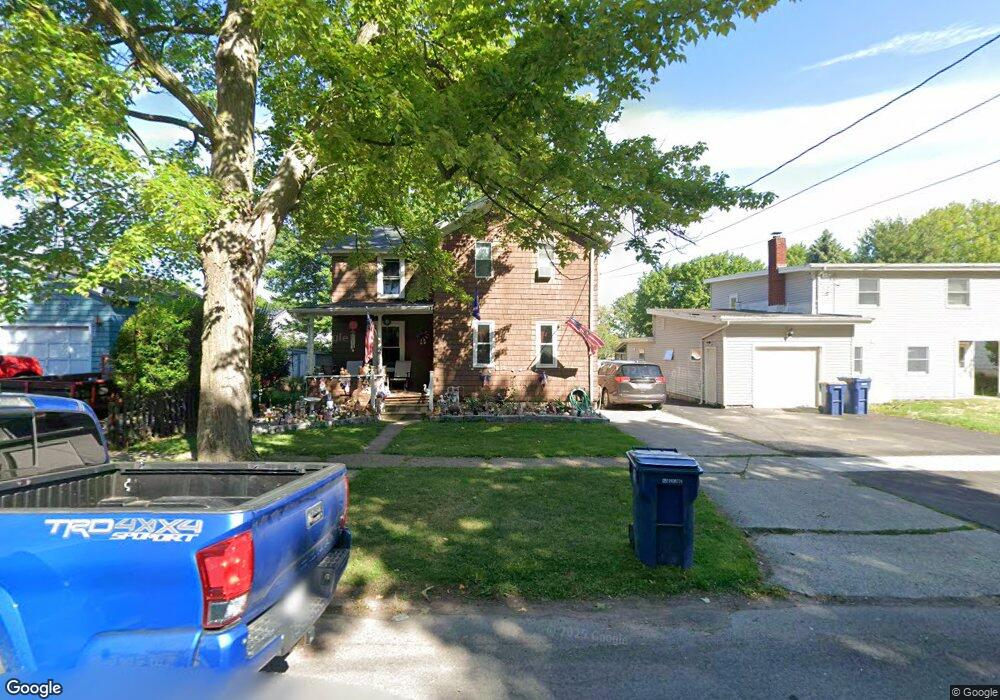
273 Union St Lockport, NY 14094
Estimated Value: $97,000 - $175,000
5
Beds
2
Baths
1,824
Sq Ft
$78/Sq Ft
Est. Value
About This Home
This home is located at 273 Union St, Lockport, NY 14094 and is currently estimated at $142,849, approximately $78 per square foot. 273 Union St is a home located in Niagara County with nearby schools including Aaron Mossell Junior High School, Lockport High School, and DeSales Catholic School.
Ownership History
Date
Name
Owned For
Owner Type
Purchase Details
Closed on
Mar 8, 2005
Sold by
Cogar Dorothy
Bought by
Tester Robert
Current Estimated Value
Home Financials for this Owner
Home Financials are based on the most recent Mortgage that was taken out on this home.
Original Mortgage
$51,750
Outstanding Balance
$26,149
Interest Rate
5.56%
Mortgage Type
New Conventional
Estimated Equity
$116,700
Purchase Details
Closed on
Mar 2, 1995
Sold by
Speranza Mary
Bought by
Cogar Dorothy
Create a Home Valuation Report for This Property
The Home Valuation Report is an in-depth analysis detailing your home's value as well as a comparison with similar homes in the area
Home Values in the Area
Average Home Value in this Area
Purchase History
| Date | Buyer | Sale Price | Title Company |
|---|---|---|---|
| Tester Robert | $57,500 | Richard May | |
| Cogar Dorothy | $4,200,000 | -- |
Source: Public Records
Mortgage History
| Date | Status | Borrower | Loan Amount |
|---|---|---|---|
| Open | Tester Robert | $51,750 | |
| Closed | Tester Robert | $5,175 |
Source: Public Records
Tax History
| Year | Tax Paid | Tax Assessment Tax Assessment Total Assessment is a certain percentage of the fair market value that is determined by local assessors to be the total taxable value of land and additions on the property. | Land | Improvement |
|---|---|---|---|---|
| 2024 | $928 | $84,000 | $5,800 | $78,200 |
| 2023 | $921 | $81,000 | $5,800 | $75,200 |
| 2022 | $565 | $72,000 | $5,800 | $66,200 |
| 2021 | $1,464 | $53,000 | $5,500 | $47,500 |
| 2020 | $1,347 | $53,000 | $5,500 | $47,500 |
| 2019 | $458 | $53,000 | $5,500 | $47,500 |
| 2018 | $762 | $53,000 | $5,500 | $47,500 |
| 2017 | $735 | $53,000 | $5,500 | $47,500 |
| 2016 | $661 | $53,000 | $5,500 | $47,500 |
| 2015 | -- | $53,000 | $5,500 | $47,500 |
| 2014 | -- | $53,000 | $5,500 | $47,500 |
Source: Public Records
Map
Nearby Homes
Your Personal Tour Guide
Ask me questions while you tour the home.