Estimated Value: $286,000 - $336,000
2
Beds
2
Baths
2,868
Sq Ft
$108/Sq Ft
Est. Value
About This Home
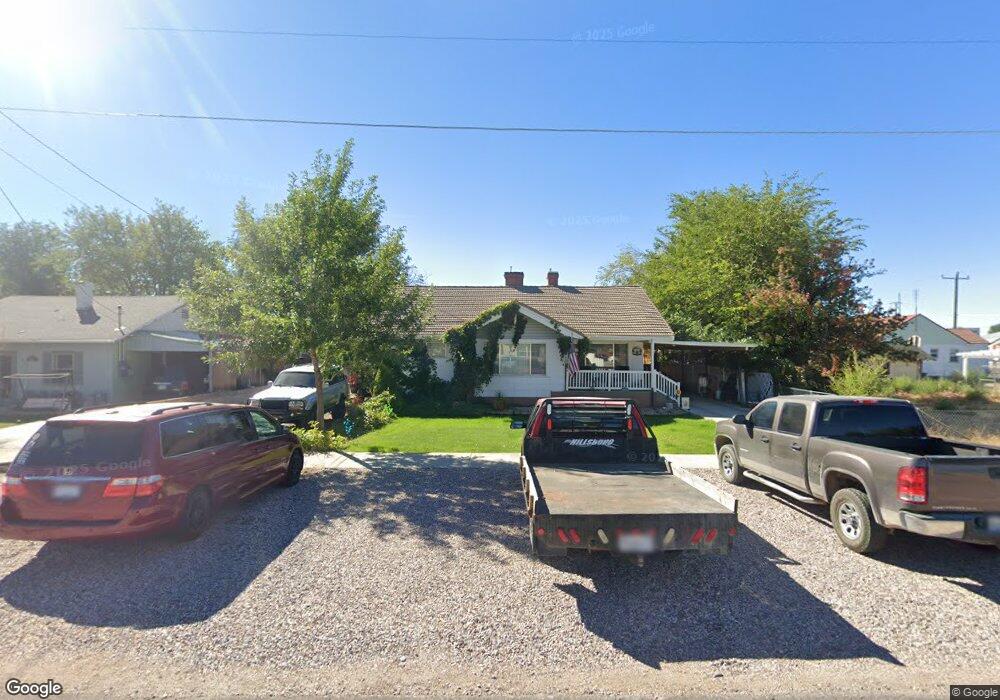
This home is located at 273 W 100 Rd N, Delta, UT 84624 and is currently estimated at $311,038, approximately $108 per square foot. 273 W 100 Rd N is a home located in Millard County with nearby schools including Cba Center and White River Academy.
Ownership History
Date
Name
Owned For
Owner Type
Purchase Details
Closed on
Sep 5, 2023
Sold by
Dalton Robert and Dalton Jamie
Bought by
Painter Joshua and Painter Nichole
Current Estimated Value
Home Financials for this Owner
Home Financials are based on the most recent Mortgage that was taken out on this home.
Original Mortgage
$184,000
Outstanding Balance
$166,558
Interest Rate
6.06%
Mortgage Type
New Conventional
Estimated Equity
$144,480
Purchase Details
Closed on
Apr 16, 2020
Sold by
Frazler D Ann P
Bought by
Dalton Robert and Dalton Jamie
Create a Home Valuation Report for This Property
The Home Valuation Report is an in-depth analysis detailing your home's value as well as a comparison with similar homes in the area
Home Values in the Area
Average Home Value in this Area
Purchase History
| Date | Buyer | Sale Price | Title Company |
|---|---|---|---|
| Painter Joshua | -- | First American Title Insurance | |
| Dalton Robert | -- | None Available |
Source: Public Records
Mortgage History
| Date | Status | Borrower | Loan Amount |
|---|---|---|---|
| Open | Painter Joshua | $184,000 |
Source: Public Records
Tax History
| Year | Tax Paid | Tax Assessment Tax Assessment Total Assessment is a certain percentage of the fair market value that is determined by local assessors to be the total taxable value of land and additions on the property. | Land | Improvement |
|---|---|---|---|---|
| 2025 | $1,799 | $192,361 | $17,717 | $174,644 |
| 2024 | $1,799 | $150,894 | $12,872 | $138,022 |
| 2023 | $1,872 | $150,894 | $12,872 | $138,022 |
| 2022 | $1,511 | $113,689 | $13,457 | $100,232 |
| 2021 | $1,281 | $91,998 | $10,176 | $81,822 |
| 2020 | $1,193 | $85,106 | $9,250 | $75,856 |
| 2019 | $1,148 | $82,017 | $8,566 | $73,451 |
| 2018 | $1,055 | $75,952 | $8,566 | $67,386 |
| 2017 | $1,091 | $75,702 | $8,316 | $67,386 |
| 2016 | -- | $75,702 | $8,316 | $67,386 |
| 2015 | $147 | $75,702 | $8,316 | $67,386 |
| 2014 | -- | $71,495 | $8,316 | $63,179 |
| 2013 | -- | $71,495 | $8,316 | $63,179 |
Source: Public Records
Map
Nearby Homes
Your Personal Tour Guide
Ask me questions while you tour the home.