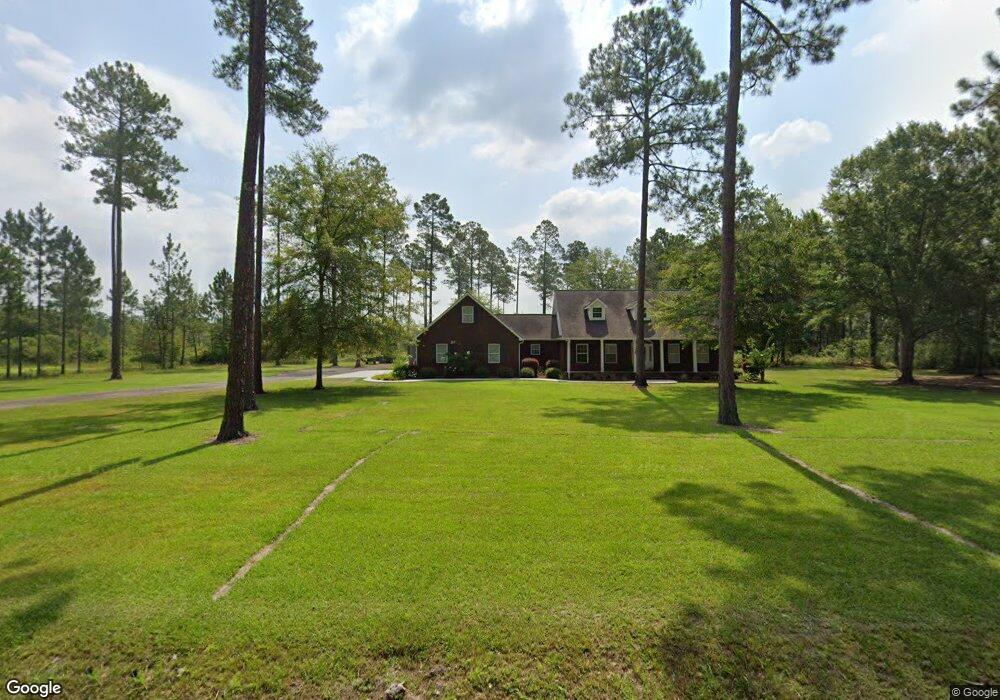
2730 Brannen Rd Waycross, GA 31503
Estimated Value: $395,000 - $445,728
3
Beds
3
Baths
2,630
Sq Ft
$161/Sq Ft
Est. Value
About This Home
This home is located at 2730 Brannen Rd, Waycross, GA 31503 and is currently estimated at $424,682, approximately $161 per square foot. 2730 Brannen Rd is a home located in Ware County with nearby schools including Waresboro Elementary School, Ware County Middle School, and Ware County High School.
Ownership History
Date
Name
Owned For
Owner Type
Purchase Details
Closed on
Jul 30, 2019
Sold by
Mccoy Warren R
Bought by
Aldridge Victor N and Aldridge Brittany Tess
Current Estimated Value
Home Financials for this Owner
Home Financials are based on the most recent Mortgage that was taken out on this home.
Original Mortgage
$237,300
Outstanding Balance
$152,281
Interest Rate
3.7%
Mortgage Type
Commercial
Estimated Equity
$272,401
Purchase Details
Closed on
Jul 27, 2016
Sold by
Jo Anna D
Bought by
Bennett Lester Lamar and Bennett Penny D
Home Financials for this Owner
Home Financials are based on the most recent Mortgage that was taken out on this home.
Original Mortgage
$228,000
Interest Rate
3.48%
Mortgage Type
New Conventional
Purchase Details
Closed on
Mar 9, 2005
Sold by
Bennett Lester L
Bought by
Milton Johnny James and Milton Joanna D
Create a Home Valuation Report for This Property
The Home Valuation Report is an in-depth analysis detailing your home's value as well as a comparison with similar homes in the area
Home Values in the Area
Average Home Value in this Area
Purchase History
| Date | Buyer | Sale Price | Title Company |
|---|---|---|---|
| Aldridge Victor N | $252,000 | -- | |
| Bennett Lester Lamar | -- | -- | |
| Mccoy Warren R | $240,000 | -- | |
| Milton Johnny James | $18,800 | -- |
Source: Public Records
Mortgage History
| Date | Status | Borrower | Loan Amount |
|---|---|---|---|
| Open | Aldridge Victor N | $237,300 | |
| Previous Owner | Mccoy Warren R | $228,000 |
Source: Public Records
Tax History Compared to Growth
Tax History
| Year | Tax Paid | Tax Assessment Tax Assessment Total Assessment is a certain percentage of the fair market value that is determined by local assessors to be the total taxable value of land and additions on the property. | Land | Improvement |
|---|---|---|---|---|
| 2024 | $2,011 | $187,144 | $5,741 | $181,403 |
| 2023 | $2,051 | $113,710 | $5,950 | $107,760 |
| 2022 | $2,125 | $101,755 | $5,950 | $95,805 |
| 2021 | $2,258 | $76,901 | $5,950 | $70,951 |
| 2020 | $2,346 | $73,994 | $5,950 | $68,044 |
| 2019 | $2,140 | $71,088 | $5,950 | $65,138 |
| 2018 | $2,160 | $68,181 | $5,950 | $62,231 |
| 2017 | $2,313 | $68,181 | $5,950 | $62,231 |
| 2016 | $2,313 | $72,950 | $6,800 | $66,150 |
| 2015 | $2,335 | $72,950 | $6,800 | $66,150 |
| 2014 | $2,332 | $72,950 | $6,800 | $66,150 |
| 2013 | -- | $72,950 | $6,800 | $66,150 |
Source: Public Records
Map
Nearby Homes
- 2180 Fulford Rd Unit n/a
- 2857 Cherokee St
- 2867 Evergreen Rd
- 2836 Evergreen Rd
- 2885 Longwood Rd
- 850 Woodard Ln
- 4517 Cameron Ln
- 4717 Smith Ln
- 4601 Old Scapa Ln
- Lot 2 Smith Ln
- 0 (Lot 19) Smith Ln
- 4601 Alma Hwy
- 4818 Lovett Rd
- 1238 Red Keen Rd
- 4600 Alma Hwy
- 400 Smith Rd
- 4606 Dukes Rd
- 1261 Lake St
- 0 (Lot 4) Elmer Thrift Rd
- 0 (Lot 3) Elmer Thrift Rd
- 2780 Brannen Rd
- 2715 Brannen Rd
- 2755 Brannen Rd
- 2700 Brannen Rd
- 00 Brannen Rd
- 2815 Brannen Rd
- 2995 Brannen Rd
- 3015 Brannen Rd
- 2625 Brannen Rd
- 0 Brannen Rd
- 2500 Brannen Rd
- 3025 Brannen Rd
- 2122 Mallard Rd
- 3764 Albany Ave
- 3744 Albany Ave
- 2338 Mallard Rd
- 2304 Mallard Rd
- 3681 Albany Ave
- 3670 Albany Ave
- 3658 Albany Ave