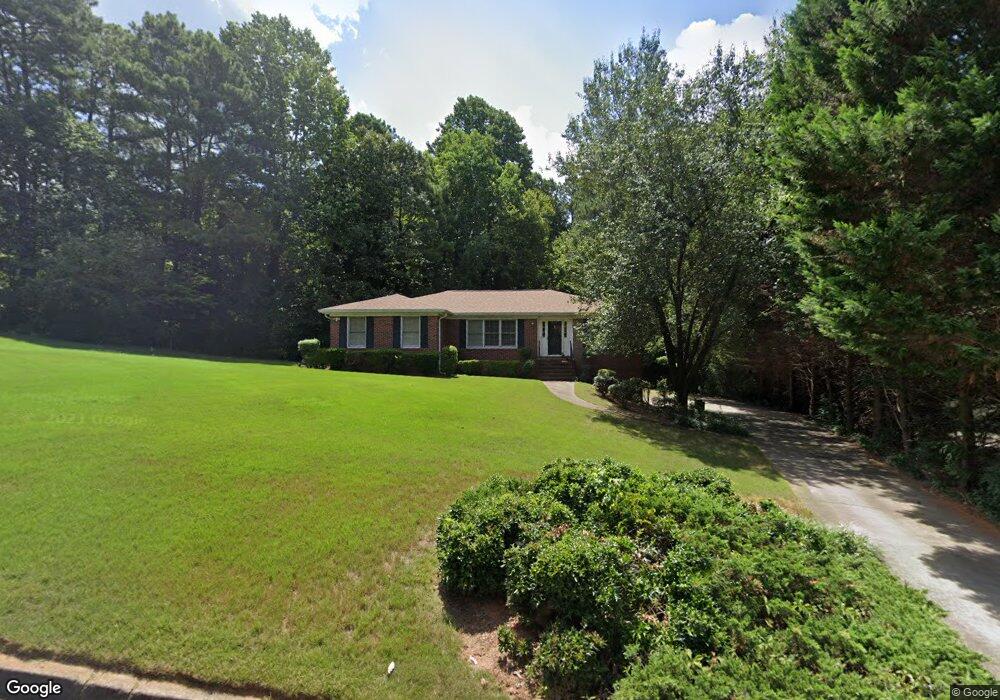
2730 Nesbit Trail Alpharetta, GA 30022
Estimated Value: $513,000 - $591,000
3
Beds
2
Baths
1,890
Sq Ft
$285/Sq Ft
Est. Value
About This Home
This home is located at 2730 Nesbit Trail, Alpharetta, GA 30022 and is currently estimated at $538,810, approximately $285 per square foot. 2730 Nesbit Trail is a home located in Fulton County with nearby schools including Hillside Elementary School, Holcomb Bridge Middle School, and Centennial High School.
Ownership History
Date
Name
Owned For
Owner Type
Purchase Details
Closed on
Sep 15, 2005
Sold by
Dave Parthiy I and Dave Devila P
Bought by
Patel Chandrakant C and Patel Bharti C
Current Estimated Value
Home Financials for this Owner
Home Financials are based on the most recent Mortgage that was taken out on this home.
Original Mortgage
$198,000
Outstanding Balance
$105,997
Interest Rate
5.86%
Mortgage Type
New Conventional
Estimated Equity
$432,813
Purchase Details
Closed on
Oct 9, 1998
Sold by
Dave Parthiv J
Bought by
Dave Parthiv J and Dave Devila P
Home Financials for this Owner
Home Financials are based on the most recent Mortgage that was taken out on this home.
Original Mortgage
$118,000
Interest Rate
6.76%
Mortgage Type
New Conventional
Create a Home Valuation Report for This Property
The Home Valuation Report is an in-depth analysis detailing your home's value as well as a comparison with similar homes in the area
Home Values in the Area
Average Home Value in this Area
Purchase History
| Date | Buyer | Sale Price | Title Company |
|---|---|---|---|
| Patel Chandrakant C | $247,500 | -- | |
| Dave Parthiv J | $1,000 | -- | |
| Davi Parthiv J | $159,000 | -- |
Source: Public Records
Mortgage History
| Date | Status | Borrower | Loan Amount |
|---|---|---|---|
| Open | Patel Chandrakant C | $198,000 | |
| Previous Owner | Davi Parthiv J | $118,000 | |
| Previous Owner | Davi Parthiv J | $25,000 |
Source: Public Records
Tax History Compared to Growth
Tax History
| Year | Tax Paid | Tax Assessment Tax Assessment Total Assessment is a certain percentage of the fair market value that is determined by local assessors to be the total taxable value of land and additions on the property. | Land | Improvement |
|---|---|---|---|---|
| 2025 | $581 | $152,480 | $29,360 | $123,120 |
| 2023 | $4,593 | $162,720 | $29,840 | $132,880 |
| 2022 | $2,383 | $141,280 | $20,280 | $121,000 |
| 2021 | $2,829 | $121,160 | $17,960 | $103,200 |
| 2020 | $2,872 | $122,520 | $15,880 | $106,640 |
| 2019 | $473 | $121,480 | $21,760 | $99,720 |
| 2018 | $2,673 | $112,320 | $14,920 | $97,400 |
| 2017 | $2,283 | $90,200 | $11,400 | $78,800 |
| 2016 | $2,282 | $90,200 | $11,400 | $78,800 |
| 2015 | $2,783 | $90,200 | $11,400 | $78,800 |
| 2014 | $1,960 | $90,200 | $11,400 | $78,800 |
Source: Public Records
Map
Nearby Homes
- 160 Arden Place
- 205 Nesbit Entry Dr
- 125 Georgian Manor Ct
- 585 Saint Regis Ln
- 9165 Nesbit Ferry Rd Unit 9
- 51 Nesbit Place
- 280 Vidaulan Ct
- 1096 Township Square
- 1094 Township Square
- 222 Buckland Dr
- 2765 Chandon Place
- 10 Regency Rd
- 2003 Falcon Glen Ct
- 9155 Nesbit Ferry Rd Unit 101
- 9155 Nesbit Ferry Rd Unit 96
- 920 Waters Reach Ct
- 215 Ridge Point Ct
- 2720 Nesbit Trail
- 2725 Nesbit Trail
- 2710 Nesbit Trail
- 2735 Nesbit Trail
- 2715 Nesbit Trail
- 9415 Nesbit Ferry Rd
- 105 Fox Grape Ln
- 2708 Nesbit Trail
- 2820 Arborwoods Dr
- 125 Arden Place
- 115 Arden Place
- 115 Fox Grape Ln Unit I
- 105 Arden Place
- 135 Arden Place
- 2705 Nesbit Trail
- 0 Nesbit Trail Unit 8742309
- 0 Nesbit Trail Unit 8642560
- 0 Nesbit Trail Unit 8525784
- 0 Nesbit Trail Unit 8437745
- 0 Nesbit Trail Unit 8020890