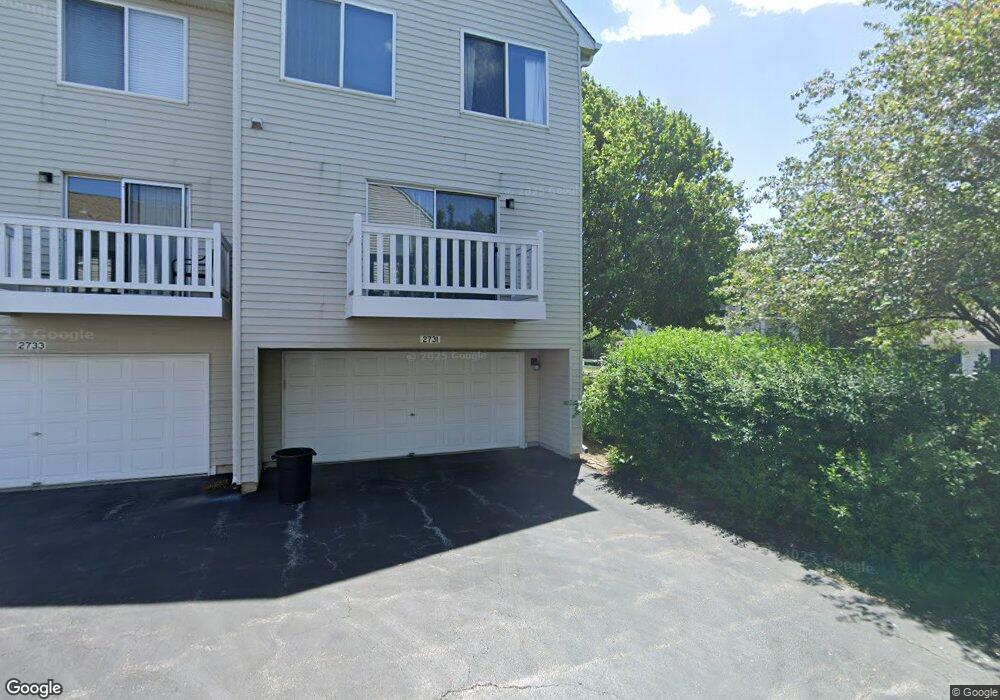
2731 Shelly Ln Aurora, IL 60504
Waubonsie NeighborhoodEstimated Value: $253,000 - $375,544
2
Beds
3
Baths
1,480
Sq Ft
$226/Sq Ft
Est. Value
About This Home
This home is located at 2731 Shelly Ln, Aurora, IL 60504 and is currently estimated at $334,386, approximately $225 per square foot. 2731 Shelly Ln is a home located in DuPage County with nearby schools including McCarty Elementary School, Fischer Middle School, and Waubonsie Valley High School.
Ownership History
Date
Name
Owned For
Owner Type
Purchase Details
Closed on
Jun 6, 2016
Sold by
Fannie Mae
Bought by
Millan Edgar
Current Estimated Value
Home Financials for this Owner
Home Financials are based on the most recent Mortgage that was taken out on this home.
Original Mortgage
$147,283
Interest Rate
3.75%
Mortgage Type
FHA
Purchase Details
Closed on
Jan 26, 2016
Sold by
Louhglin Martin and Case 14 Ch 000997
Bought by
Federal National Mortgage Association
Purchase Details
Closed on
Sep 13, 1995
Sold by
First Bank & Trust Company
Bought by
Loughlin Martin H and Loughlin Debora A
Home Financials for this Owner
Home Financials are based on the most recent Mortgage that was taken out on this home.
Original Mortgage
$121,400
Interest Rate
7.8%
Create a Home Valuation Report for This Property
The Home Valuation Report is an in-depth analysis detailing your home's value as well as a comparison with similar homes in the area
Home Values in the Area
Average Home Value in this Area
Purchase History
| Date | Buyer | Sale Price | Title Company |
|---|---|---|---|
| Millan Edgar | $150,000 | Attorneys Title Guaranty Fun | |
| Federal National Mortgage Association | -- | Attorney | |
| Loughlin Martin H | $128,500 | -- |
Source: Public Records
Mortgage History
| Date | Status | Borrower | Loan Amount |
|---|---|---|---|
| Previous Owner | Millan Edgar | $147,283 | |
| Previous Owner | Loughlin Martin H | $121,400 |
Source: Public Records
Tax History Compared to Growth
Tax History
| Year | Tax Paid | Tax Assessment Tax Assessment Total Assessment is a certain percentage of the fair market value that is determined by local assessors to be the total taxable value of land and additions on the property. | Land | Improvement |
|---|---|---|---|---|
| 2024 | $5,295 | $77,636 | $14,891 | $62,745 |
| 2023 | $5,019 | $69,760 | $13,380 | $56,380 |
| 2022 | $4,808 | $63,330 | $12,040 | $51,290 |
| 2021 | $4,672 | $61,070 | $11,610 | $49,460 |
| 2020 | $4,729 | $61,070 | $11,610 | $49,460 |
| 2019 | $4,550 | $58,080 | $11,040 | $47,040 |
| 2018 | $3,470 | $45,290 | $8,700 | $36,590 |
| 2017 | $3,401 | $43,750 | $8,400 | $35,350 |
| 2016 | $3,662 | $39,600 | $7,600 | $32,000 |
| 2015 | $3,637 | $37,600 | $7,220 | $30,380 |
| 2014 | $3,590 | $36,030 | $6,930 | $29,100 |
| 2013 | $3,551 | $36,280 | $6,980 | $29,300 |
Source: Public Records
Map
Nearby Homes
- 2750 Shelly Ln
- 2901 Shelly Ln
- 2950 Shelly Ln Unit 2950
- 3140 Medford Ct
- 2476 Village Ct Unit 2
- 308 Foxworth Ct
- 3132 Portland Ct
- 3131 Portland Ct
- 3357 Ravinia Cir
- 295 Meadowview Ln
- 1335 Lawrence Ct
- 2297 Lakeside Dr Unit 10
- 441 Park Ridge Ln Unit C
- 164 Park Ridge Ln
- 227 Vaughn Rd
- 1465 Bridgeport Ln Unit 19D
- 72 Heather Glen Dr Unit 72
- 167 Forestview Ct
- 2860 Bridgeport Ln Unit 19D
- 1896 Sedgegrass Trail
- 2731 Shelly Ln
- 2733 Shelly Ln
- 2735 Shelly Ln Unit 25
- 2735 Shelly Ln Unit 2735
- 2737 Shelly Ln
- 2723 Shelly Ln
- 2721 Shelly Ln Unit 25
- 2725 Shelly Ln
- 2739 Shelly Ln
- 2727 Shelly Ln
- 2771 Shelly Ln
- 2773 Shelly Ln
- 2775 Shelly Ln
- 2777 Shelly Ln Unit 25
- 2779 Shelly Ln
- 2781 Shelly Ln
- 2748 Shelly Ln
- 2746 Shelly Ln
- 2744 Shelly Ln
- 2791 Shelly Ln