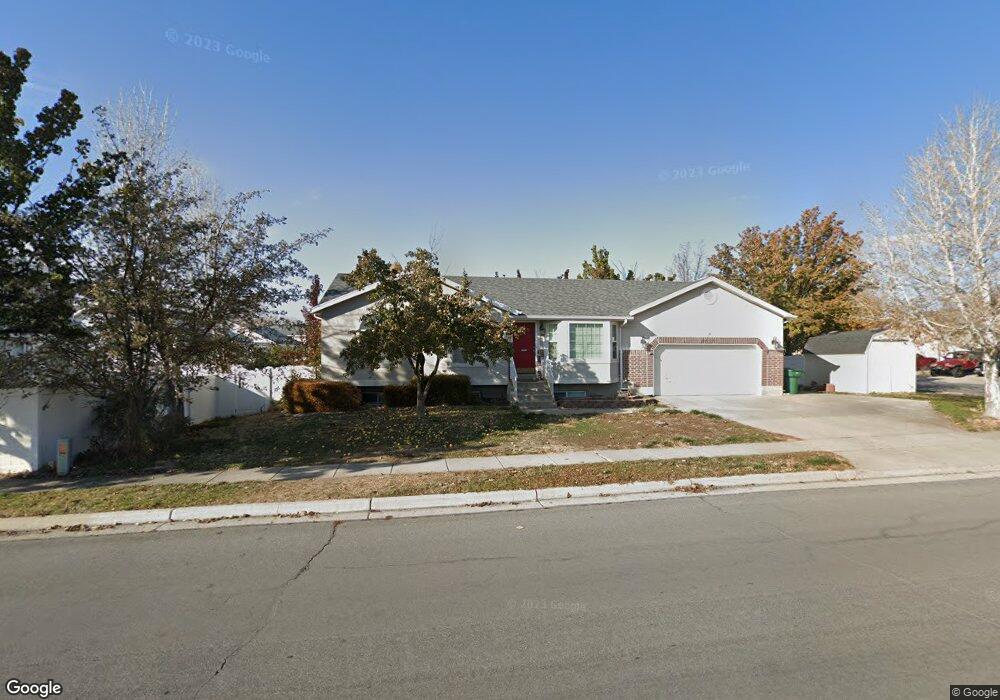
2731 W 1475 N Layton, UT 84041
Estimated Value: $488,000 - $536,000
--
Bed
3
Baths
1,266
Sq Ft
$407/Sq Ft
Est. Value
About This Home
This home is located at 2731 W 1475 N, Layton, UT 84041 and is currently estimated at $515,009, approximately $406 per square foot. 2731 W 1475 N is a home located in Davis County with nearby schools including Legacy Junior High School, Layton High School, and North Davis Preparatory Academy.
Ownership History
Date
Name
Owned For
Owner Type
Purchase Details
Closed on
Apr 8, 2014
Sold by
Thornley James C and Thornley Julia A
Bought by
Such Lexton Ralph and Such Myrna
Current Estimated Value
Home Financials for this Owner
Home Financials are based on the most recent Mortgage that was taken out on this home.
Original Mortgage
$130,812
Outstanding Balance
$99,075
Interest Rate
4.32%
Mortgage Type
VA
Estimated Equity
$415,934
Purchase Details
Closed on
Mar 26, 1999
Sold by
Country West Const & Real Estate Inc
Bought by
Thornley James C and Thornley Julia A
Home Financials for this Owner
Home Financials are based on the most recent Mortgage that was taken out on this home.
Original Mortgage
$140,757
Interest Rate
6.73%
Mortgage Type
FHA
Create a Home Valuation Report for This Property
The Home Valuation Report is an in-depth analysis detailing your home's value as well as a comparison with similar homes in the area
Home Values in the Area
Average Home Value in this Area
Purchase History
| Date | Buyer | Sale Price | Title Company |
|---|---|---|---|
| Such Lexton Ralph | -- | Metro National Title | |
| Thornley James C | -- | Bonneville Title Company Inc |
Source: Public Records
Mortgage History
| Date | Status | Borrower | Loan Amount |
|---|---|---|---|
| Open | Such Lexton Ralph | $130,812 | |
| Previous Owner | Thornley James C | $140,757 |
Source: Public Records
Tax History Compared to Growth
Tax History
| Year | Tax Paid | Tax Assessment Tax Assessment Total Assessment is a certain percentage of the fair market value that is determined by local assessors to be the total taxable value of land and additions on the property. | Land | Improvement |
|---|---|---|---|---|
| 2025 | $2,447 | $256,850 | $100,900 | $155,950 |
| 2024 | $2,361 | $249,700 | $112,524 | $137,176 |
| 2023 | $2,264 | $422,000 | $115,293 | $306,707 |
| 2022 | $2,483 | $251,350 | $73,391 | $177,959 |
| 2021 | $2,246 | $339,000 | $110,122 | $228,878 |
| 2020 | $2,023 | $293,000 | $92,264 | $200,736 |
| 2019 | $1,960 | $278,000 | $95,783 | $182,217 |
| 2018 | $1,889 | $269,000 | $83,884 | $185,116 |
| 2016 | $1,662 | $122,100 | $32,390 | $89,710 |
| 2015 | $1,678 | $116,985 | $32,390 | $84,595 |
| 2014 | $1,518 | $108,214 | $32,390 | $75,824 |
| 2013 | -- | $100,733 | $28,952 | $71,781 |
Source: Public Records
Map
Nearby Homes