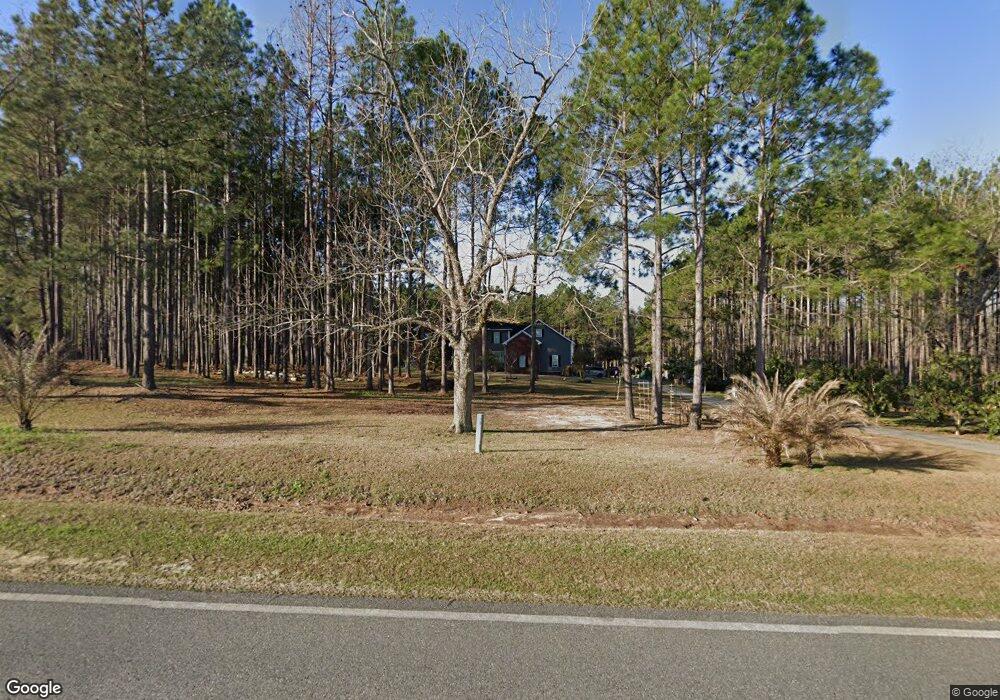
2731 Whiddon Mill Rd Tifton, GA 31793
Estimated Value: $578,000 - $839,058
6
Beds
4
Baths
4,718
Sq Ft
$150/Sq Ft
Est. Value
About This Home
This home is located at 2731 Whiddon Mill Rd, Tifton, GA 31793 and is currently estimated at $708,765, approximately $150 per square foot. 2731 Whiddon Mill Rd is a home located in Tift County with nearby schools including Annie Belle Clark Primary School, Matt Wilson Elementary School, and J.T. Reddick School.
Ownership History
Date
Name
Owned For
Owner Type
Purchase Details
Closed on
Oct 7, 2024
Sold by
Flores Esthela Lopez
Bought by
Serna Heriberto Torres
Current Estimated Value
Home Financials for this Owner
Home Financials are based on the most recent Mortgage that was taken out on this home.
Original Mortgage
$270,000
Outstanding Balance
$266,895
Interest Rate
6.35%
Mortgage Type
New Conventional
Estimated Equity
$441,870
Purchase Details
Closed on
May 23, 2016
Sold by
Serna Heriberto Torres
Bought by
Serna Heriberto Torres and Flores Esthela Lopez
Home Financials for this Owner
Home Financials are based on the most recent Mortgage that was taken out on this home.
Original Mortgage
$314,500
Interest Rate
3.59%
Mortgage Type
New Conventional
Purchase Details
Closed on
Oct 6, 2003
Sold by
Doss Russell M
Bought by
Mclemore Brett and Mclemore Wendy G
Create a Home Valuation Report for This Property
The Home Valuation Report is an in-depth analysis detailing your home's value as well as a comparison with similar homes in the area
Home Values in the Area
Average Home Value in this Area
Purchase History
| Date | Buyer | Sale Price | Title Company |
|---|---|---|---|
| Serna Heriberto Torres | -- | -- | |
| Serna Heriberto Torres | -- | -- | |
| Serna Heriberto Torres | $370,000 | -- | |
| Mclemore Brett | $20,000 | -- |
Source: Public Records
Mortgage History
| Date | Status | Borrower | Loan Amount |
|---|---|---|---|
| Open | Serna Heriberto Torres | $270,000 | |
| Previous Owner | Serna Heriberto Torres | $314,500 |
Source: Public Records
Tax History Compared to Growth
Tax History
| Year | Tax Paid | Tax Assessment Tax Assessment Total Assessment is a certain percentage of the fair market value that is determined by local assessors to be the total taxable value of land and additions on the property. | Land | Improvement |
|---|---|---|---|---|
| 2024 | $6,485 | $299,230 | $12,582 | $286,648 |
| 2023 | $7,046 | $171,266 | $8,400 | $162,866 |
| 2022 | $4,967 | $169,339 | $8,400 | $160,939 |
| 2021 | $4,996 | $169,339 | $8,400 | $160,939 |
| 2020 | $5,092 | $169,339 | $8,400 | $160,939 |
| 2019 | $5,226 | $174,119 | $8,400 | $165,719 |
| 2018 | $4,675 | $156,197 | $8,400 | $147,797 |
| 2017 | $4,447 | $156,197 | $8,400 | $147,797 |
| 2016 | $4,702 | $156,197 | $8,400 | $147,797 |
| 2015 | $4,703 | $156,197 | $8,400 | $147,797 |
| 2014 | $4,713 | $156,197 | $8,400 | $147,797 |
| 2013 | -- | $156,197 | $8,400 | $147,797 |
Source: Public Records
Map
Nearby Homes
- 577 Zion Hope Rd
- 14 Faye Ct
- 7 Deborah Dr
- 31 Henry Way
- 0 W Hutchinson Rd
- 26 Alan Ln
- W Hutchinson Rd
- 2008 Rutland Rd Unit 10
- 2008 Rutland Rd
- 1808 Rutland Rd
- 0 Carpenter Rd N
- 131 Oak Point Ave
- Tract 1 Whiddon Mill Rd
- 106 Mill Ridge Cir
- 50 Margaret Ln
- Cottle Rd
- 51 Logan Dr
- 7 Red Oak Rd
- 4341 U S 82
- 4341 U S 82
- 2719 Whiddon Mill Rd
- 0 Rigdon-Altman Rd
- 2709 Whiddon Mill Rd
- 685 Rigdon Aultman Rd
- 2703 Whiddon Mill Rd
- 2755 Whiddon Mill Rd
- 2700 Whiddon Mill Rd
- 677 Rigdon Aultman Rd
- 2695 Whiddon Mill Rd
- 2761 Whiddon Mill Rd
- 2692 Whiddon Mill Rd
- 656 Rigdon Aultman Rd
- 657 Rigdon Aultman Rd
- 2783 Whiddon Mill Rd
- 2788 Whiddon Mill Rd
- 20 Hoke Pearman Rd
- 2686 Whiddon Mill Rd
- 8 Hoke Pearman Rd
- 2647 Whiddon Mill Rd
- 785 Dorminey Doss Rd