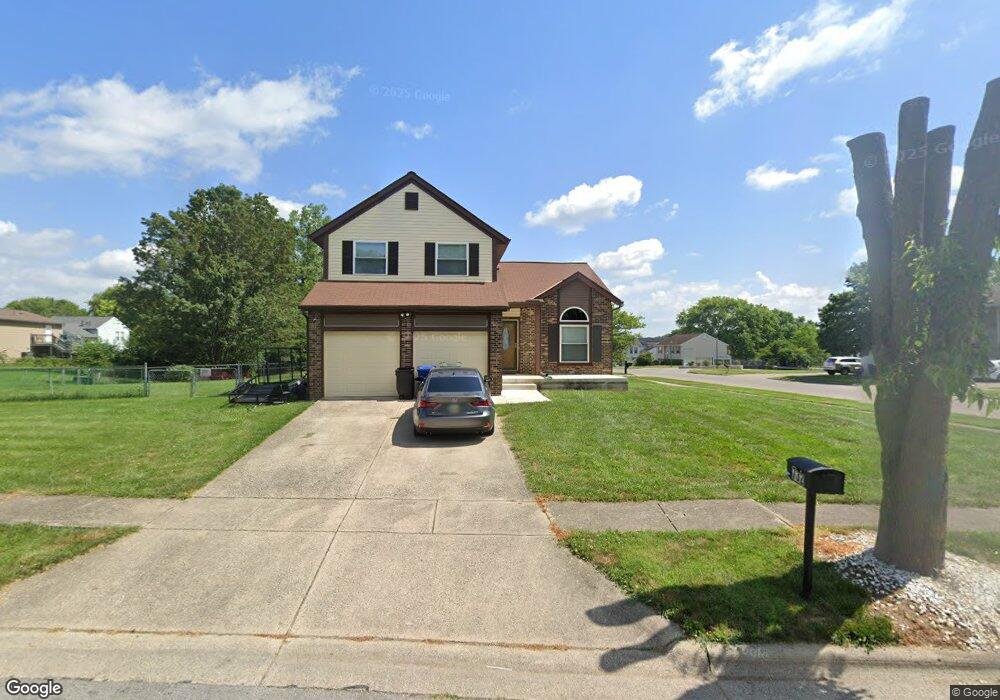
2732 Buggywhip Ln Columbus, OH 43207
Obetz-Lockbourne NeighborhoodEstimated Value: $249,000 - $296,000
3
Beds
3
Baths
1,516
Sq Ft
$179/Sq Ft
Est. Value
About This Home
This home is located at 2732 Buggywhip Ln, Columbus, OH 43207 and is currently estimated at $270,717, approximately $178 per square foot. 2732 Buggywhip Ln is a home located in Franklin County with nearby schools including Groveport Madison High School, South Columbus Preparatory Academy at Southfield, and Groveport Community School.
Ownership History
Date
Name
Owned For
Owner Type
Purchase Details
Closed on
May 20, 2010
Sold by
Valentine Raymond W and Hall Patricia E
Bought by
Parham Gerald
Current Estimated Value
Home Financials for this Owner
Home Financials are based on the most recent Mortgage that was taken out on this home.
Original Mortgage
$116,432
Outstanding Balance
$78,549
Interest Rate
5.5%
Mortgage Type
FHA
Estimated Equity
$192,168
Purchase Details
Closed on
Jul 30, 1997
Sold by
Owens Colossah J and Owens Corinna
Bought by
Valentine Raymond W and Valentine Margaret A
Home Financials for this Owner
Home Financials are based on the most recent Mortgage that was taken out on this home.
Original Mortgage
$91,002
Interest Rate
7.71%
Mortgage Type
FHA
Purchase Details
Closed on
Aug 31, 1987
Purchase Details
Closed on
May 1, 1987
Create a Home Valuation Report for This Property
The Home Valuation Report is an in-depth analysis detailing your home's value as well as a comparison with similar homes in the area
Home Values in the Area
Average Home Value in this Area
Purchase History
| Date | Buyer | Sale Price | Title Company |
|---|---|---|---|
| Parham Gerald | $118,000 | Real Living | |
| Valentine Raymond W | $91,500 | Amerititle East | |
| -- | $74,500 | -- | |
| -- | $9,500 | -- |
Source: Public Records
Mortgage History
| Date | Status | Borrower | Loan Amount |
|---|---|---|---|
| Open | Parham Gerald | $116,432 | |
| Previous Owner | Valentine Raymond W | $91,002 |
Source: Public Records
Tax History
| Year | Tax Paid | Tax Assessment Tax Assessment Total Assessment is a certain percentage of the fair market value that is determined by local assessors to be the total taxable value of land and additions on the property. | Land | Improvement |
|---|---|---|---|---|
| 2025 | $3,350 | $79,000 | $20,230 | $58,770 |
| 2024 | $3,350 | $79,000 | $20,230 | $58,770 |
| 2023 | $3,318 | $78,995 | $20,230 | $58,765 |
| 2022 | $2,331 | $46,170 | $10,570 | $35,600 |
| 2021 | $2,338 | $46,170 | $10,570 | $35,600 |
| 2020 | $2,342 | $46,170 | $10,570 | $35,600 |
| 2019 | $2,354 | $41,510 | $9,170 | $32,340 |
| 2018 | $2,292 | $41,510 | $9,170 | $32,340 |
| 2017 | $2,376 | $41,510 | $9,170 | $32,340 |
| 2016 | $2,191 | $33,500 | $6,900 | $26,600 |
| 2015 | $2,214 | $33,500 | $6,900 | $26,600 |
| 2014 | $2,145 | $33,500 | $6,900 | $26,600 |
| 2013 | $991 | $35,245 | $7,245 | $28,000 |
Source: Public Records
Map
Nearby Homes
- 4142 Oldentime Ct
- 3950 Wintercress Ct
- 3939 Marsha Dr
- 3847 Pendent Ln
- 3782 Willowtree Ln
- 3768 Pendent Ln
- 3688 Tea Party Place Unit 273
- 2629 Patrick Henry Ave Unit 40
- 2535 Bridlewood Ct
- 3516 Meadow Valley St
- 2883 Valley Green Dr
- 2366 E Howard Rd
- 4310 Charlotte Rd
- 2291 E Howard Rd
- 2697 Meigs Dr
- 2693 Meigs Dr
- 2689 Meigs Dr
- 2685 Meigs Dr
- 2681 Meigs Dr
- 2690 Meigs Dr
- 4091 Plateau St
- 4083 Plateau St
- 4099 Plateau St
- 4081 Plateau St
- 4105 Plateau St
- 2724 Buggywhip Ln
- 4090 Plateau St
- 4098 Plateau St
- 4082 Plateau St
- 4075 Plateau St
- 4111 Plateau St
- 4111 Buggywhip Ln
- 4073 Plateau St
- 2708 Buggywhip Ln
- 4096 Plateau St
- 4074 Plateau St
- 2701 Buckwheat Ct
- 4065 Plateau St
- 4080 Plateau St
- 2700 Millview Dr
Your Personal Tour Guide
Ask me questions while you tour the home.