Estimated Value: $451,000 - $512,000
4
Beds
2
Baths
2,371
Sq Ft
$206/Sq Ft
Est. Value
About This Home
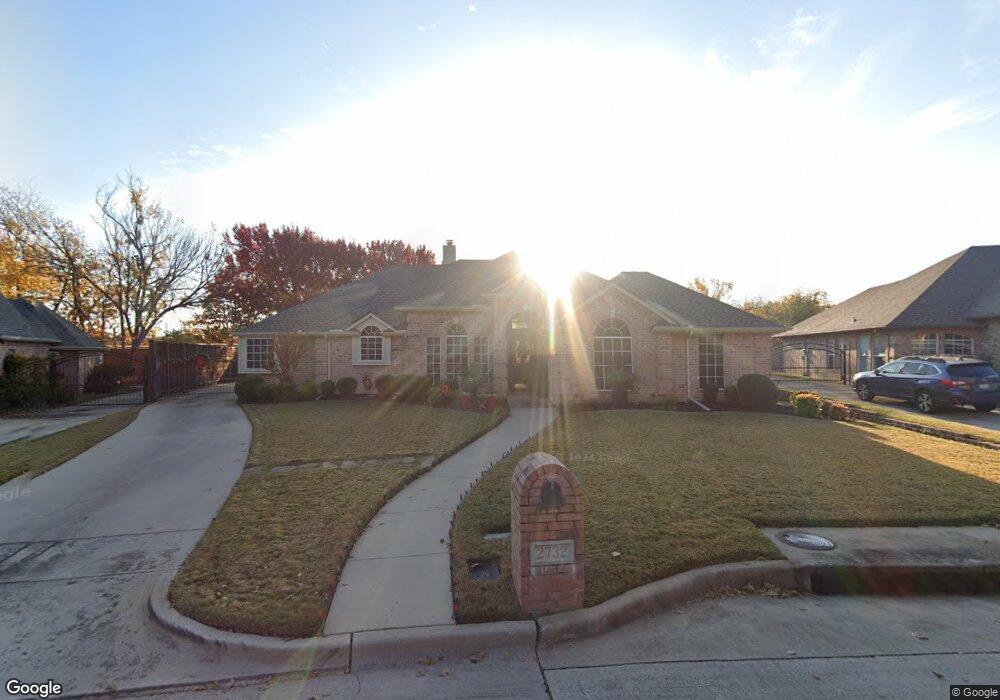
This home is located at 2732 Montreal Dr, Hurst, TX 76054 and is currently estimated at $488,656, approximately $206 per square foot. 2732 Montreal Dr is a home located in Tarrant County with nearby schools including Bransford Elementary School, Colleyville Middle School, and Grapevine High School.
Ownership History
Date
Name
Owned For
Owner Type
Purchase Details
Closed on
Nov 19, 2007
Sold by
Swindell Mitchell T and Swindell Prissy H
Bought by
Ciha Stewart K and Ciha Teresa L
Current Estimated Value
Home Financials for this Owner
Home Financials are based on the most recent Mortgage that was taken out on this home.
Original Mortgage
$183,600
Outstanding Balance
$116,405
Interest Rate
6.42%
Mortgage Type
Purchase Money Mortgage
Estimated Equity
$372,251
Purchase Details
Closed on
Dec 1, 1994
Sold by
Norwood National Corp
Bought by
Swindell Mitchell T and Swindell Prissy H
Home Financials for this Owner
Home Financials are based on the most recent Mortgage that was taken out on this home.
Original Mortgage
$135,200
Interest Rate
6.62%
Mortgage Type
Construction
Create a Home Valuation Report for This Property
The Home Valuation Report is an in-depth analysis detailing your home's value as well as a comparison with similar homes in the area
Home Values in the Area
Average Home Value in this Area
Purchase History
| Date | Buyer | Sale Price | Title Company |
|---|---|---|---|
| Ciha Stewart K | -- | Rattikin Title | |
| Swindell Mitchell T | -- | First American Title Co |
Source: Public Records
Mortgage History
| Date | Status | Borrower | Loan Amount |
|---|---|---|---|
| Open | Ciha Stewart K | $183,600 | |
| Previous Owner | Swindell Mitchell T | $135,200 |
Source: Public Records
Tax History Compared to Growth
Tax History
| Year | Tax Paid | Tax Assessment Tax Assessment Total Assessment is a certain percentage of the fair market value that is determined by local assessors to be the total taxable value of land and additions on the property. | Land | Improvement |
|---|---|---|---|---|
| 2025 | $2,326 | $392,347 | $85,000 | $307,347 |
| 2024 | $2,326 | $481,452 | $85,000 | $396,452 |
| 2023 | $3,460 | $484,478 | $85,000 | $399,478 |
| 2022 | $8,259 | $355,461 | $55,000 | $300,461 |
| 2021 | $8,945 | $357,721 | $55,000 | $302,721 |
| 2020 | $8,118 | $323,091 | $55,000 | $268,091 |
| 2019 | $8,358 | $325,076 | $55,000 | $270,076 |
| 2018 | $2,358 | $303,235 | $55,000 | $248,235 |
| 2017 | $7,254 | $306,797 | $55,000 | $251,797 |
| 2016 | $6,595 | $264,866 | $40,000 | $224,866 |
| 2015 | $5,419 | $229,600 | $25,000 | $204,600 |
| 2014 | $5,419 | $229,600 | $25,000 | $204,600 |
Source: Public Records
Map
Nearby Homes
- 4600 Bransford Rd
- 312 Bremen Dr
- 405 Bremen Dr
- 114 Glade Rd
- 112 Glade Rd
- 2732 Woodbridge Dr
- 1921 Maplewood Trail
- 3713 Brentwood Ct
- 3208 Glade Pointe Ct
- 628 Huntwich Dr
- 2844 Hurstview Dr
- 2116 Cottage Oak Ln
- 3132 Hurstview Dr
- 405 Woodbriar Ct
- 2620 Brookridge Dr
- 4105 Inwood Ln
- 5104 Shadowood Rd
- 2809 Sandstone Dr
- 2829 Sandstone Dr
- 4600 Westbury Dr
- 2728 Montreal Dr
- 2736 Montreal Dr
- 2724 Montreal Dr
- 2740 Montreal Dr
- 2733 Montreal Dr
- 2729 Montreal Dr
- 2737 Montreal Dr
- 2720 Montreal Dr
- 2744 Montreal Dr
- 2725 Montreal Dr
- 103 Heneretta Dr
- 105 Heneretta Dr
- 2800 Mill Ridge Dr
- 2716 Montreal Dr
- 2721 Montreal Dr
- 97 Bremen Dr
- 107 Heneretta Dr
- 2712 Montreal Dr
- 2804 Mill Ridge Dr
- 94 Bremen Dr