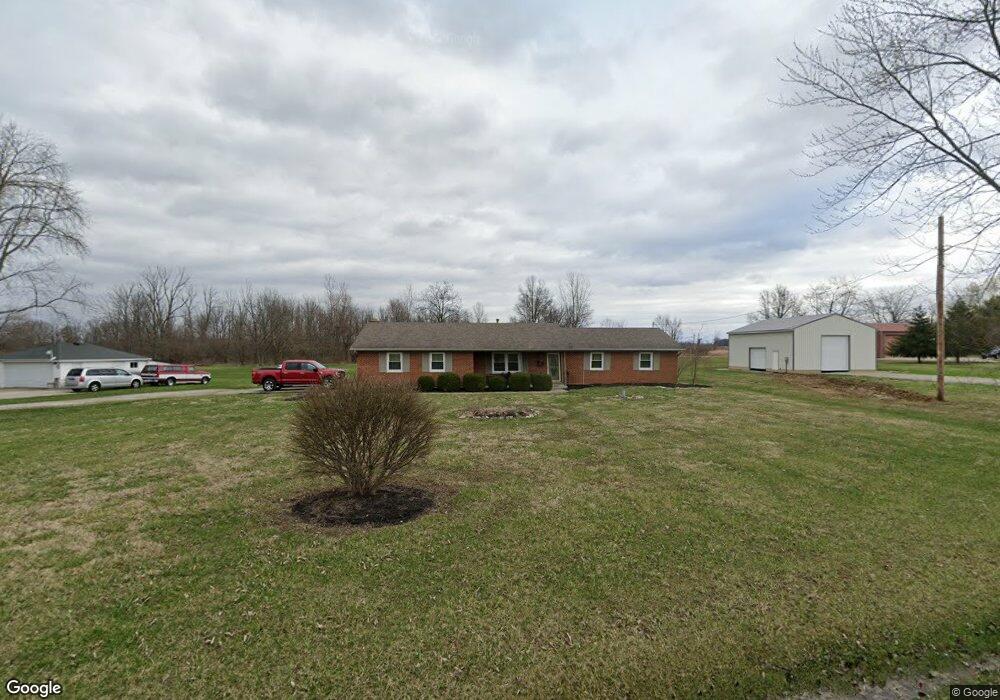
2732 S Tecumseh Rd Springfield, OH 45502
Estimated Value: $290,000 - $366,000
3
Beds
2
Baths
1,656
Sq Ft
$194/Sq Ft
Est. Value
About This Home
This home is located at 2732 S Tecumseh Rd, Springfield, OH 45502 and is currently estimated at $320,516, approximately $193 per square foot. 2732 S Tecumseh Rd is a home located in Clark County with nearby schools including Greenon Elementary School, Greenon Jr. High School, and Greenon High School.
Ownership History
Date
Name
Owned For
Owner Type
Purchase Details
Closed on
Aug 28, 2008
Sold by
Accredited Home Lenders Inc
Bought by
Green Charles W and Green Pamela R
Current Estimated Value
Home Financials for this Owner
Home Financials are based on the most recent Mortgage that was taken out on this home.
Original Mortgage
$88,000
Outstanding Balance
$58,204
Interest Rate
6.66%
Mortgage Type
Purchase Money Mortgage
Estimated Equity
$262,313
Purchase Details
Closed on
Mar 14, 2008
Sold by
Gay William A and Case #07 Cv 0814
Bought by
Accredited Home Lenders Inc
Purchase Details
Closed on
Apr 15, 2005
Sold by
Ellis Marjorie L
Bought by
Gay William A and Gay Janet E
Home Financials for this Owner
Home Financials are based on the most recent Mortgage that was taken out on this home.
Original Mortgage
$130,815
Interest Rate
10.25%
Mortgage Type
Fannie Mae Freddie Mac
Purchase Details
Closed on
Apr 23, 1996
Sold by
Ellis Harold M
Bought by
Baird John T and Baird Betty J
Create a Home Valuation Report for This Property
The Home Valuation Report is an in-depth analysis detailing your home's value as well as a comparison with similar homes in the area
Purchase History
| Date | Buyer | Sale Price | Title Company |
|---|---|---|---|
| Green Charles W | $110,000 | Ohio Real Estate Title | |
| Accredited Home Lenders Inc | $94,000 | None Available | |
| Gay William A | $153,900 | -- | |
| Baird John T | $90,650 | -- |
Source: Public Records
Mortgage History
| Date | Status | Borrower | Loan Amount |
|---|---|---|---|
| Open | Green Charles W | $88,000 | |
| Previous Owner | Gay William A | $130,815 |
Source: Public Records
Tax History
| Year | Tax Paid | Tax Assessment Tax Assessment Total Assessment is a certain percentage of the fair market value that is determined by local assessors to be the total taxable value of land and additions on the property. | Land | Improvement |
|---|---|---|---|---|
| 2025 | $4,610 | $110,850 | $21,470 | $89,380 |
| 2024 | $4,501 | $85,830 | $20,760 | $65,070 |
| 2023 | $4,501 | $85,830 | $20,760 | $65,070 |
| 2022 | $4,215 | $80,550 | $20,760 | $59,790 |
| 2021 | $3,445 | $58,370 | $15,040 | $43,330 |
| 2020 | $3,454 | $58,370 | $15,040 | $43,330 |
| 2019 | $3,501 | $58,370 | $15,040 | $43,330 |
| 2018 | $3,242 | $52,840 | $13,790 | $39,050 |
| 2017 | $3,249 | $52,840 | $13,787 | $39,053 |
| 2016 | $2,832 | $52,840 | $13,787 | $39,053 |
| 2015 | $2,636 | $47,415 | $12,534 | $34,881 |
| 2014 | $2,641 | $47,415 | $12,534 | $34,881 |
| 2013 | $2,324 | $47,415 | $12,534 | $34,881 |
Source: Public Records
Map
Nearby Homes
- 2925 S Tecumseh Rd
- 3190 Rebert Pike
- 3864 Quailhollow Ct
- 3183 Lower Valley Pike
- 100 Green Valley Dr
- 3434 Killdeer Dr
- 303 E Main St
- 141 N Xenia Dr
- 1513 Ridgeway Dr
- 3924 Schenley St
- 1290 Red Oaks Cir
- 5152 S Tecumseh Rd
- 206 S Tecumseh Rd
- 3319 Wendover St
- 4200 Phillips St
- 2170 Fairfield Pike
- 4024 Raymond Dr
- 3267 Lower Valley Pike Unit Tract 2
- 4538 Cynthia Dr
- 1010 Meadow Lark Dr
- 2704 S Tecumseh Rd
- 2682 S Tecumseh Rd
- 2755 S Tecumseh Rd
- 2750 S Tecumseh Rd
- 2656 S Tecumseh Rd
- 2800 S Tecumseh Rd
- 2630 S Tecumseh Rd
- 2861 S Tecumseh Rd
- 2801 S Tecumseh Rd
- 2875 S Tecumseh Rd
- 2608 S Tecumseh Rd
- 2611 S Tecumseh Rd
- 2901 S Tecumseh Rd
- 2566 S Tecumseh Rd
- 2552 S Tecumseh Rd
- 2953 S Tecumseh Rd
- 2530 S Tecumseh Rd
- 2537 S Tecumseh Rd
- 2934 S Tecumseh Rd
- 2516 S Tecumseh Rd
Your Personal Tour Guide
Ask me questions while you tour the home.