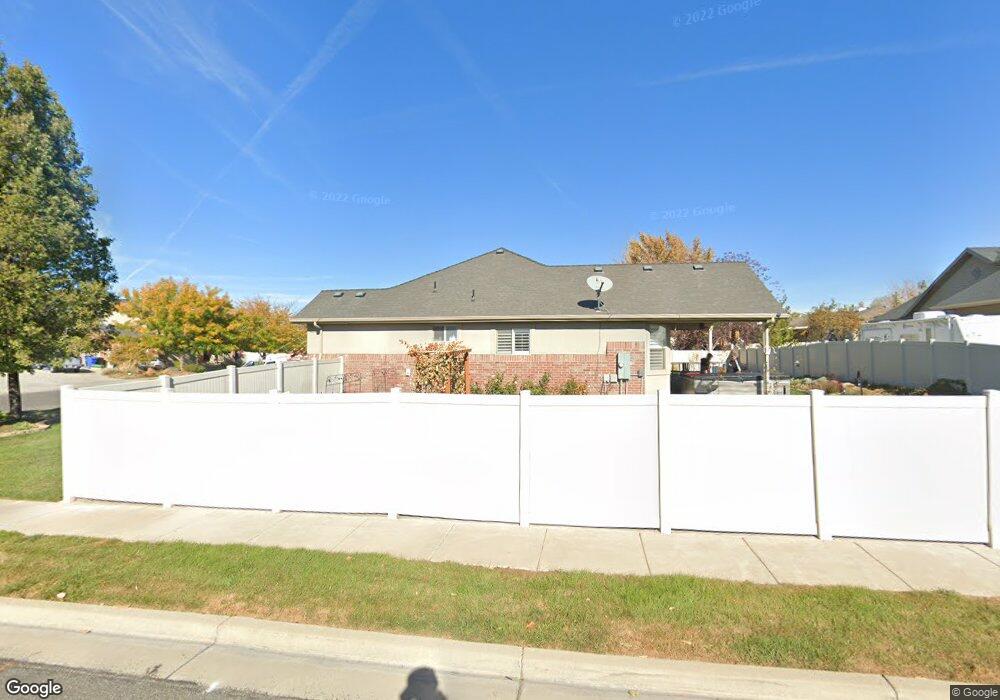
2732 W 625 N West Point, UT 84015
Estimated Value: $618,000 - $681,000
5
Beds
3
Baths
1,623
Sq Ft
$401/Sq Ft
Est. Value
About This Home
This home is located at 2732 W 625 N, West Point, UT 84015 and is currently estimated at $651,357, approximately $401 per square foot. 2732 W 625 N is a home located in Davis County with nearby schools including Lakeside School, West Point Junior High School, and Syracuse High School.
Ownership History
Date
Name
Owned For
Owner Type
Purchase Details
Closed on
Aug 19, 2019
Sold by
Nance Korey W
Bought by
Butler Janae
Current Estimated Value
Home Financials for this Owner
Home Financials are based on the most recent Mortgage that was taken out on this home.
Original Mortgage
$400,000
Outstanding Balance
$350,326
Interest Rate
3.7%
Mortgage Type
New Conventional
Estimated Equity
$301,031
Purchase Details
Closed on
May 10, 2018
Sold by
Nance Korey W and Nance Margo E
Bought by
Korey W Nance and Nance Revocable Living Trust
Purchase Details
Closed on
Mar 16, 2006
Sold by
Craythorne Construction Co Inc
Bought by
Nance Korey and Nance Margo
Home Financials for this Owner
Home Financials are based on the most recent Mortgage that was taken out on this home.
Original Mortgage
$49,500
Interest Rate
6.25%
Mortgage Type
Stand Alone Second
Create a Home Valuation Report for This Property
The Home Valuation Report is an in-depth analysis detailing your home's value as well as a comparison with similar homes in the area
Home Values in the Area
Average Home Value in this Area
Purchase History
| Date | Buyer | Sale Price | Title Company |
|---|---|---|---|
| Butler Janae | -- | Inwest Title Services | |
| Korey W Nance | -- | Founders Title | |
| Nance Korey W | -- | Founders Title | |
| Nance Korey | -- | Bonneville Title Company |
Source: Public Records
Mortgage History
| Date | Status | Borrower | Loan Amount |
|---|---|---|---|
| Open | Butler Janae | $400,000 | |
| Previous Owner | Nance Korey | $49,500 | |
| Previous Owner | Nance Korey | $197,950 |
Source: Public Records
Tax History Compared to Growth
Tax History
| Year | Tax Paid | Tax Assessment Tax Assessment Total Assessment is a certain percentage of the fair market value that is determined by local assessors to be the total taxable value of land and additions on the property. | Land | Improvement |
|---|---|---|---|---|
| 2025 | $3,762 | $352,550 | $104,296 | $248,254 |
| 2024 | $3,576 | $336,600 | $93,911 | $242,689 |
| 2023 | $3,338 | $578,000 | $116,149 | $461,851 |
| 2022 | $3,493 | $331,100 | $60,164 | $270,936 |
| 2021 | $3,209 | $455,000 | $94,986 | $360,014 |
| 2020 | $2,830 | $396,000 | $79,617 | $316,383 |
| 2019 | $2,501 | $345,000 | $77,297 | $267,703 |
| 2018 | $2,272 | $309,000 | $77,695 | $231,305 |
| 2016 | $2,060 | $147,400 | $34,810 | $112,590 |
| 2015 | $2,236 | $151,635 | $34,810 | $116,825 |
| 2014 | $2,008 | $138,036 | $34,810 | $103,226 |
| 2013 | -- | $123,057 | $38,157 | $84,900 |
Source: Public Records
Map
Nearby Homes