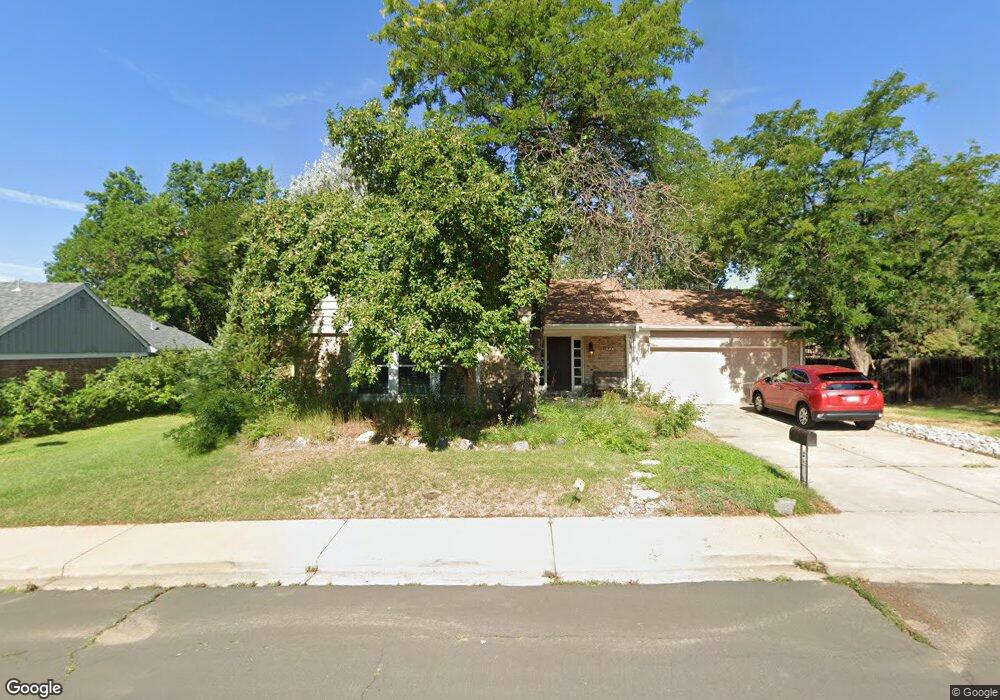
2733 S Macon St Aurora, CO 80014
Dam East/West NeighborhoodEstimated Value: $582,471 - $617,000
5
Beds
3
Baths
3,062
Sq Ft
$197/Sq Ft
Est. Value
About This Home
This home is located at 2733 S Macon St, Aurora, CO 80014 and is currently estimated at $603,118, approximately $196 per square foot. 2733 S Macon St is a home located in Arapahoe County with nearby schools including Polton Community Elementary School, Prairie Middle School, and Overland High School.
Ownership History
Date
Name
Owned For
Owner Type
Purchase Details
Closed on
Feb 28, 2020
Sold by
Bekerman Joshua A
Bought by
Bekerman Joshua A and Bekerman Ilyse
Current Estimated Value
Home Financials for this Owner
Home Financials are based on the most recent Mortgage that was taken out on this home.
Original Mortgage
$333,000
Outstanding Balance
$295,476
Interest Rate
3.6%
Mortgage Type
New Conventional
Estimated Equity
$307,642
Purchase Details
Closed on
Jul 22, 2019
Sold by
The Elizabeth V Mcadams Trust
Bought by
Rekerman Joshua A
Home Financials for this Owner
Home Financials are based on the most recent Mortgage that was taken out on this home.
Original Mortgage
$332,192
Interest Rate
3.82%
Mortgage Type
New Conventional
Purchase Details
Closed on
Oct 11, 2017
Sold by
Mcadams Elizabeth V
Bought by
Elizabeth V Mcadams Trust
Purchase Details
Closed on
Mar 28, 1989
Sold by
Conversion Arapco
Bought by
Mcadams Elizabeth V
Purchase Details
Closed on
Jul 4, 1776
Bought by
Conversion Arapco
Create a Home Valuation Report for This Property
The Home Valuation Report is an in-depth analysis detailing your home's value as well as a comparison with similar homes in the area
Home Values in the Area
Average Home Value in this Area
Purchase History
| Date | Buyer | Sale Price | Title Company |
|---|---|---|---|
| Bekerman Joshua A | -- | Land Title Guarantee Co | |
| Rekerman Joshua A | $415,240 | Land Title Guarantee Co | |
| Elizabeth V Mcadams Trust | -- | None Available | |
| Mcadams Elizabeth V | -- | -- | |
| Conversion Arapco | -- | -- |
Source: Public Records
Mortgage History
| Date | Status | Borrower | Loan Amount |
|---|---|---|---|
| Open | Bekerman Joshua A | $333,000 | |
| Closed | Rekerman Joshua A | $332,192 |
Source: Public Records
Tax History Compared to Growth
Tax History
| Year | Tax Paid | Tax Assessment Tax Assessment Total Assessment is a certain percentage of the fair market value that is determined by local assessors to be the total taxable value of land and additions on the property. | Land | Improvement |
|---|---|---|---|---|
| 2024 | $2,566 | $37,085 | -- | -- |
| 2023 | $2,566 | $37,085 | $0 | $0 |
| 2022 | $2,167 | $29,781 | $0 | $0 |
| 2021 | $2,171 | $29,781 | $0 | $0 |
| 2020 | $2,122 | $29,408 | $0 | $0 |
| 2019 | $1,552 | $29,408 | $0 | $0 |
| 2018 | $1,366 | $25,589 | $0 | $0 |
| 2017 | $1,346 | $25,589 | $0 | $0 |
| 2016 | $1,121 | $22,431 | $0 | $0 |
| 2015 | $1,077 | $22,431 | $0 | $0 |
| 2014 | -- | $16,955 | $0 | $0 |
| 2013 | -- | $19,700 | $0 | $0 |
Source: Public Records
Map
Nearby Homes
- 2792 S Macon Cir
- 2826 S Lansing Way
- 2889 S Newark Place
- 2915 S Lansing Way
- 2786 S Kenton Ct
- 2591 S Oakland St
- 11132 E Harvard Dr
- 2976 S Parker Ct
- 3017 S Macon Cir
- 11623 E Cornell Cir
- 2460 S Moline Way
- 2409 S Lima St
- 11911 E Harvard Ave Unit 103
- 11990 E Bates Cir
- 11617 E Wesley Ave
- 12003 E Harvard Ave Unit 206
- 12053 E Harvard Ave Unit 107
- 12005 E Harvard Ave Unit 207
- 12033 E Harvard Ave Unit 207
- 12256 E Bates Cir
- 2753 S Macon St
- 2712 S Macon Cir
- 2703 S Macon St
- 2772 S Macon Cir
- 2782 S Macon Cir
- 2742 S Macon Cir
- 11403 E Yale Place
- 11433 E Yale Place
- 11434 E Yale Place
- 2814 S Macon Cir
- 2711 S Macon Cir
- 2721 S Macon Cir
- 2844 S Macon Cir
- 2701 S Macon Cir
- 2781 S Macon Cir
- 2771 S Macon Cir
- 11463 E Yale Place
- 11464 E Yale Place
- 2731 S Macon Cir
- 2791 S Macon Cir