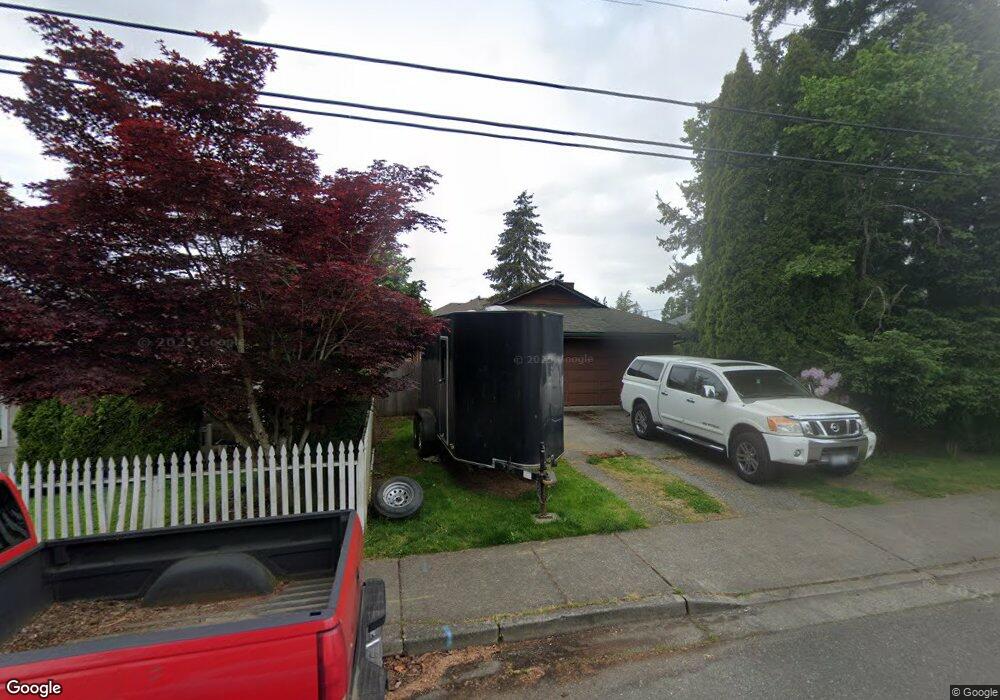
2733 St Paul St Bellingham, WA 98226
Roosevelt NeighborhoodEstimated Value: $482,000 - $623,000
3
Beds
1
Bath
1,300
Sq Ft
$449/Sq Ft
Est. Value
About This Home
This home is located at 2733 St Paul St, Bellingham, WA 98226 and is currently estimated at $583,559, approximately $448 per square foot. 2733 St Paul St is a home located in Whatcom County with nearby schools including Sunnyland Elementary School, Shuksan Middle School, and Squalicum High School.
Ownership History
Date
Name
Owned For
Owner Type
Purchase Details
Closed on
Feb 22, 2010
Sold by
Wells Fargo Financial Washington 1 Inc
Bought by
Malley Bryan
Current Estimated Value
Home Financials for this Owner
Home Financials are based on the most recent Mortgage that was taken out on this home.
Original Mortgage
$136,000
Outstanding Balance
$89,738
Interest Rate
4.97%
Mortgage Type
New Conventional
Estimated Equity
$493,821
Purchase Details
Closed on
Oct 29, 2009
Sold by
Gudmundson Sandra
Bought by
Wells Fargo Financial Washington 1 Inc
Create a Home Valuation Report for This Property
The Home Valuation Report is an in-depth analysis detailing your home's value as well as a comparison with similar homes in the area
Home Values in the Area
Average Home Value in this Area
Purchase History
| Date | Buyer | Sale Price | Title Company |
|---|---|---|---|
| Malley Bryan | $170,280 | First American Title Insuran | |
| Wells Fargo Financial Washington 1 Inc | -- | None Available |
Source: Public Records
Mortgage History
| Date | Status | Borrower | Loan Amount |
|---|---|---|---|
| Open | Malley Bryan | $136,000 |
Source: Public Records
Tax History Compared to Growth
Tax History
| Year | Tax Paid | Tax Assessment Tax Assessment Total Assessment is a certain percentage of the fair market value that is determined by local assessors to be the total taxable value of land and additions on the property. | Land | Improvement |
|---|---|---|---|---|
| 2024 | $4,352 | $545,240 | $238,607 | $306,633 |
| 2023 | $4,352 | $559,089 | $244,668 | $314,421 |
| 2022 | $3,553 | $481,982 | $210,924 | $271,058 |
| 2021 | $3,486 | $382,525 | $167,400 | $215,125 |
| 2020 | $3,260 | $354,190 | $155,000 | $199,190 |
| 2019 | $2,918 | $320,146 | $126,441 | $193,705 |
| 2018 | $2,939 | $287,377 | $113,521 | $173,856 |
| 2017 | $2,535 | $247,422 | $97,736 | $149,686 |
| 2016 | $2,218 | $223,029 | $87,704 | $135,325 |
| 2015 | $2,175 | $203,169 | $80,104 | $123,065 |
| 2014 | -- | $192,760 | $76,000 | $116,760 |
| 2013 | -- | $192,580 | $70,875 | $121,705 |
Source: Public Records
Map
Nearby Homes
- 1735 Sunup Loop
- 1737 Sunup Loop
- 1733 Sunup Loop
- 1712 Sunup Loop
- 1714 Sunup Loop
- 1716 Sunup Loop
- 2602 Woburn St
- 2330 Verona St
- 2325 Valencia St
- 2312 Orleans St
- 2409 Xenia St
- 2316 Xenia St
- 2735 Michigan St
- 2935 King St
- 2138 Woburn St
- 3374 Southbend Place Unit 101
- 1825 E Sunset Dr
- 950 Yew St
- 2432 Grant St
- 2413 E Sunset Dr
- 2735 St Paul St
- 1619 Valhalla St
- 1621 Valhalla St
- 1731 Sunup Loop
- 1739 Sunup Loop
- 1727 Sunup Loop
- 1725 Sunup Loop
- 1617 Valhalla St
- 1615 Valhalla St
- 2739 St Paul St
- 1608 E Maryland St
- 1610 E Maryland St
- 1613 Valhalla St
- 1706 Valhalla St
- 2726 St Paul St
- 1730 Sunup Loop
- 1618 Valhalla St
- 1620 Valhalla St
- 2742 St Paul St
- 2720 Saint Paul St