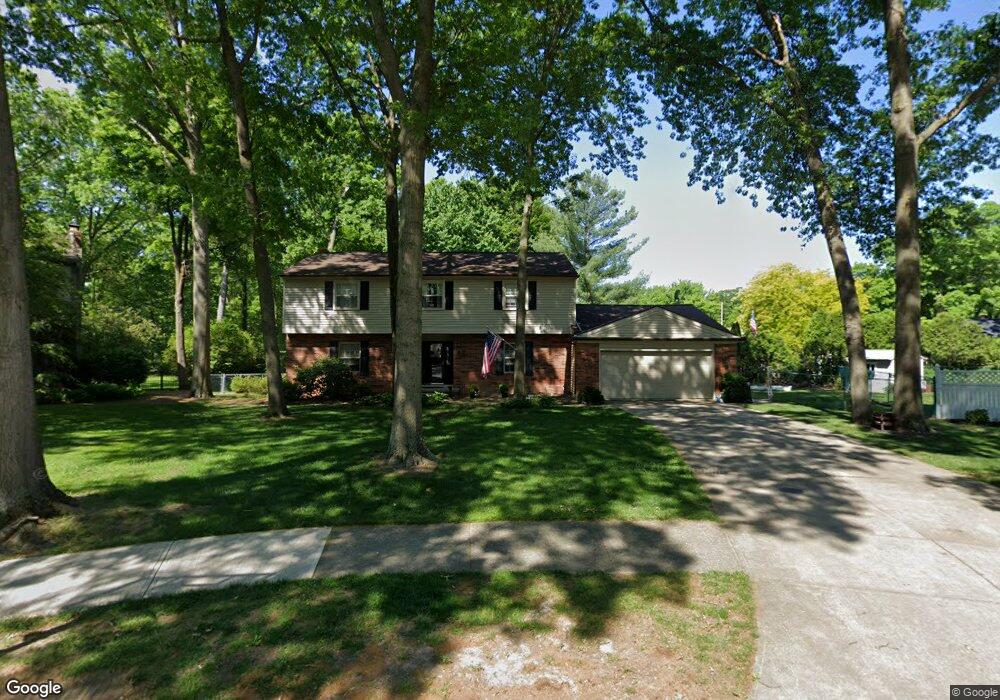
27336 Sturbridge Ln Westlake, OH 44145
Estimated Value: $453,808 - $508,000
4
Beds
3
Baths
2,582
Sq Ft
$186/Sq Ft
Est. Value
About This Home
This home is located at 27336 Sturbridge Ln, Westlake, OH 44145 and is currently estimated at $481,452, approximately $186 per square foot. 27336 Sturbridge Ln is a home located in Cuyahoga County with nearby schools including Westlake Elementary School, Dover Intermediate School, and Lee Burneson Middle School.
Ownership History
Date
Name
Owned For
Owner Type
Purchase Details
Closed on
Apr 24, 2015
Sold by
Killeen Christopher M and Killeen Kathleen A
Bought by
Killeen Christopher M and Killeen Kathleen A
Current Estimated Value
Home Financials for this Owner
Home Financials are based on the most recent Mortgage that was taken out on this home.
Original Mortgage
$227,881
Outstanding Balance
$175,491
Interest Rate
3.75%
Mortgage Type
FHA
Estimated Equity
$305,961
Purchase Details
Closed on
Aug 5, 2009
Sold by
Mcclain Richard R and Mcclain Deborah
Bought by
Kileen Christopher M and Kileen Kathleen A
Home Financials for this Owner
Home Financials are based on the most recent Mortgage that was taken out on this home.
Original Mortgage
$244,963
Interest Rate
5.36%
Mortgage Type
FHA
Purchase Details
Closed on
Jun 1, 1984
Sold by
North John S and P R
Bought by
Mcclain Richard R and Mcclain Deborah
Purchase Details
Closed on
Jan 1, 1975
Bought by
North John S and P R
Create a Home Valuation Report for This Property
The Home Valuation Report is an in-depth analysis detailing your home's value as well as a comparison with similar homes in the area
Home Values in the Area
Average Home Value in this Area
Purchase History
| Date | Buyer | Sale Price | Title Company |
|---|---|---|---|
| Killeen Christopher M | -- | Attorney | |
| Kileen Christopher M | $267,500 | Barristers Title Agency | |
| Mcclain Richard R | $120,000 | -- | |
| North John S | -- | -- |
Source: Public Records
Mortgage History
| Date | Status | Borrower | Loan Amount |
|---|---|---|---|
| Open | Killeen Christopher M | $227,881 | |
| Closed | Kileen Christopher M | $244,963 |
Source: Public Records
Tax History Compared to Growth
Tax History
| Year | Tax Paid | Tax Assessment Tax Assessment Total Assessment is a certain percentage of the fair market value that is determined by local assessors to be the total taxable value of land and additions on the property. | Land | Improvement |
|---|---|---|---|---|
| 2024 | $6,845 | $144,480 | $17,395 | $127,085 |
| 2023 | $5,842 | $105,430 | $19,500 | $85,930 |
| 2022 | $5,748 | $105,420 | $19,500 | $85,930 |
| 2021 | $5,756 | $105,420 | $19,500 | $85,930 |
| 2020 | $5,601 | $94,120 | $17,400 | $76,720 |
| 2019 | $5,431 | $268,900 | $49,700 | $219,200 |
| 2018 | $5,455 | $94,120 | $17,400 | $76,720 |
| 2017 | $6,173 | $100,170 | $17,990 | $82,180 |
| 2016 | $6,140 | $100,170 | $17,990 | $82,180 |
| 2015 | -- | $100,170 | $17,990 | $82,180 |
| 2014 | -- | $93,630 | $16,800 | $76,830 |
Source: Public Records
Map
Nearby Homes
- 27320 Langale Rd
- 1528 Dover Center Rd
- 27841 Birchwood Ct
- 1455 Mozart Dr
- 1326 Marview Dr
- 879 S Parkside Dr
- 1504 Beethoven Dr
- 841 S Parkside Dr
- 27870 Birchwood Ct
- 28180 Detroit Rd Unit A2
- 26927 E Oviatt Rd
- 28200 Detroit Rd Unit D3
- 1721 Merlot Ln
- Bowman Plan at Hope Pointe Place
- Ashton Plan at Hope Pointe Place
- 28163 Zinfandel Ct
- 28167 Zinfandel Ct
- 1432 Stone Ct
- 0 Hilliard Blvd Unit 5128276
- 27029 Normandy Rd
- 27318 Sturbridge Ln
- 1109 Richmar Dr
- 27352 Sturbridge Ln
- 27370 Sturbridge Ln
- 1121 Richmar Dr
- 27299 Sturbridge Ln
- 1127 Richmar Dr
- 27263 Sturbridge Ln
- 27281 Sturbridge Ln
- 27380 Dellwood Dr
- 27364 Dellwood Dr
- 27255 Sturbridge Ln
- 27346 Dellwood Dr
- 1075 Richmar Dr
- 27396 Dellwood Dr
- 1139 Richmar Dr
- 1096 Richmar Dr
- 27219 Sturbridge Ln
- 1116 Richmar Dr
- 27328 Dellwood Dr