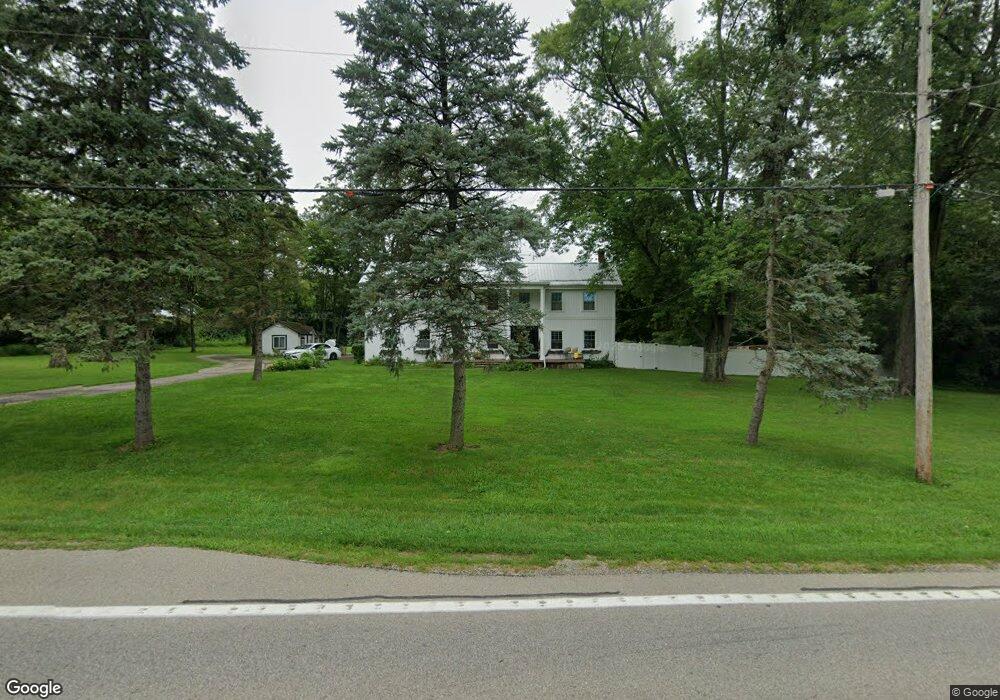
2734 E State Route 73 Waynesville, OH 45068
Clearcreek Township NeighborhoodEstimated Value: $548,000 - $725,000
4
Beds
3
Baths
3,520
Sq Ft
$186/Sq Ft
Est. Value
About This Home
This home is located at 2734 E State Route 73, Waynesville, OH 45068 and is currently estimated at $655,664, approximately $186 per square foot. 2734 E State Route 73 is a home located in Warren County with nearby schools including Clearcreek Elementary School, Springboro Intermediate School, and Springboro Junior High School.
Ownership History
Date
Name
Owned For
Owner Type
Purchase Details
Closed on
Oct 7, 2009
Sold by
Federal Home Loan Mortgage Corporation
Bought by
Banks John M and Banks Sherrie
Current Estimated Value
Home Financials for this Owner
Home Financials are based on the most recent Mortgage that was taken out on this home.
Original Mortgage
$215,663
Interest Rate
4.87%
Mortgage Type
FHA
Purchase Details
Closed on
Nov 10, 2008
Sold by
Mills Price Freda
Bought by
Federal Home Loan Mortgage Corp
Purchase Details
Closed on
May 16, 1996
Sold by
Throckmorton Robert S
Bought by
Mills Freda and Mills Price
Purchase Details
Closed on
Dec 2, 1985
Sold by
Coverdale William Hjr and Hjr William
Bought by
Throckmorton and Throckmorton Robert S
Purchase Details
Closed on
Aug 4, 1981
Sold by
Coverdale Coverdale and Coverdale William Hugh
Create a Home Valuation Report for This Property
The Home Valuation Report is an in-depth analysis detailing your home's value as well as a comparison with similar homes in the area
Home Values in the Area
Average Home Value in this Area
Purchase History
| Date | Buyer | Sale Price | Title Company |
|---|---|---|---|
| Banks John M | $205,000 | None Available | |
| Federal Home Loan Mortgage Corp | $173,334 | None Available | |
| Mills Freda | $235,000 | -- | |
| Throckmorton | $145,000 | -- | |
| -- | -- | -- |
Source: Public Records
Mortgage History
| Date | Status | Borrower | Loan Amount |
|---|---|---|---|
| Previous Owner | Banks John M | $215,663 |
Source: Public Records
Tax History Compared to Growth
Tax History
| Year | Tax Paid | Tax Assessment Tax Assessment Total Assessment is a certain percentage of the fair market value that is determined by local assessors to be the total taxable value of land and additions on the property. | Land | Improvement |
|---|---|---|---|---|
| 2024 | $6,212 | $151,530 | $53,350 | $98,180 |
| 2023 | $5,423 | $121,481 | $33,582 | $87,899 |
| 2022 | $5,304 | $121,482 | $33,583 | $87,899 |
| 2021 | $4,990 | $121,482 | $33,583 | $87,899 |
| 2020 | $4,691 | $98,767 | $27,304 | $71,463 |
| 2019 | $4,349 | $98,767 | $27,304 | $71,463 |
| 2018 | $4,341 | $98,767 | $27,304 | $71,463 |
| 2017 | $4,131 | $84,434 | $23,076 | $61,359 |
| 2016 | $4,299 | $84,434 | $23,076 | $61,359 |
| 2015 | $4,305 | $84,434 | $23,076 | $61,359 |
| 2014 | $4,305 | $79,820 | $22,480 | $57,340 |
| 2013 | $4,303 | $95,510 | $24,500 | $71,010 |
Source: Public Records
Map
Nearby Homes
- 7476 Waterway Dr
- 0 Township Line Rd Unit 944079
- 7 Cumberland Ct
- 2814 Station House Way
- 6 Cumberland Ct
- 5 Cumberland Ct
- 4 Cumberland Ct
- 3 Cumberland Ct
- 8 Cumberland Ct
- 2 Cumberland Ct
- 17 Country Lakes Blvd
- 50 Dale Hollow Way
- 49 Dale Hollow Way
- 11 Country Lakes Blvd
- 51 Dale Hollow Way
- 18 Dale Hollow Way
- 39 Dale Hollow Way
- 48 Dale Hollow Way
- 40 Dale Hollow Way
- 38 Dale Hollow Way
- 2734 E State Route 73
- 2692 E State Route 73
- 2725 E State Route 73
- 2755 E State Route 73
- 2755 E St Rt 73
- 2654 E State Route 73
- 2832 E State Route 73
- 2626 Ohio 73
- 2626 E State Route 73
- 2925 Station House Way
- 2931 Station House Way
- 2937 Station House Way
- 2919 Station House Way
- 2943 Station House Way
- 2913 Station House Way
- 2949 Station House Way
- 2596 E State Route 73
- 2596 E State Route 73
- 1 Station House Way
- 2800 Station House Way