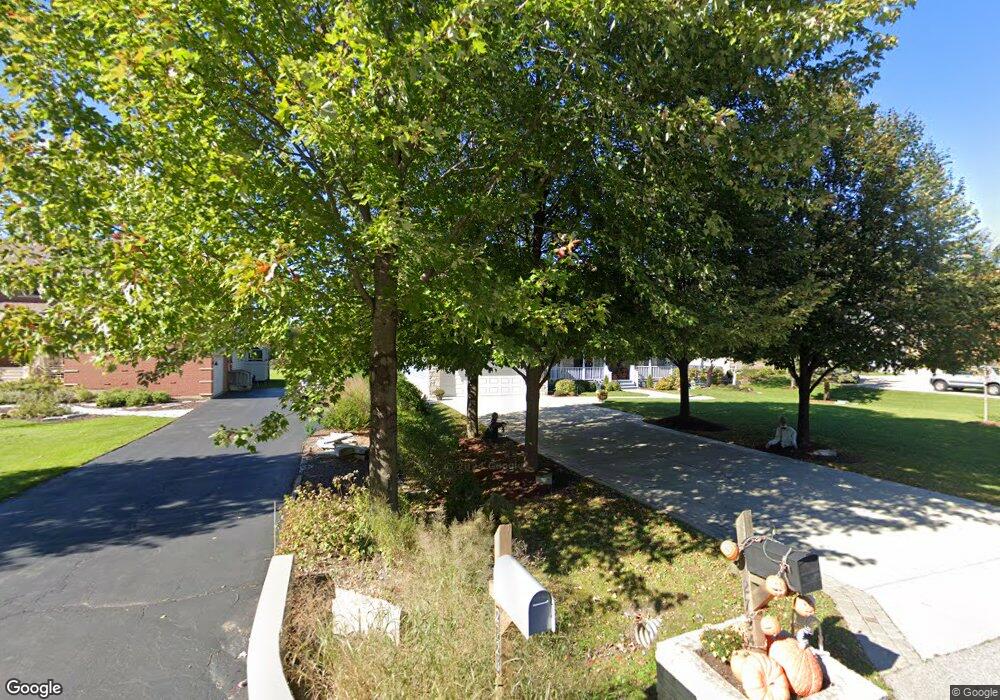
2734 N Vista Rd Arlington Heights, IL 60004
Estimated Value: $746,000 - $1,288,000
3
Beds
4
Baths
3,521
Sq Ft
$269/Sq Ft
Est. Value
About This Home
This home is located at 2734 N Vista Rd, Arlington Heights, IL 60004 and is currently estimated at $948,417, approximately $269 per square foot. 2734 N Vista Rd is a home located in Cook County with nearby schools including J.W. Riley Elementary School, Jack London Middle School, and Buffalo Grove High School.
Ownership History
Date
Name
Owned For
Owner Type
Purchase Details
Closed on
Dec 2, 2013
Sold by
Opie Jeffrey R and Wiederhold Brenda
Bought by
Opie Jeffrey R and The Jeffrey R Opie Living Trust
Current Estimated Value
Purchase Details
Closed on
Aug 14, 2002
Sold by
Ars Development Company
Bought by
Opie Jeffrey R and Wiederhold Brenda L
Purchase Details
Closed on
Aug 27, 1999
Sold by
Skarb Jonathan B and Skarb Janie I
Bought by
Zarazinski Paul and Zarazinski Renee
Home Financials for this Owner
Home Financials are based on the most recent Mortgage that was taken out on this home.
Original Mortgage
$180,000
Interest Rate
7.9%
Purchase Details
Closed on
Feb 1, 1995
Sold by
Zumbrock Lawrence O and Zumbrock Harold B
Bought by
Skarb Jonathan B and Skarb Janie I
Home Financials for this Owner
Home Financials are based on the most recent Mortgage that was taken out on this home.
Original Mortgage
$156,000
Interest Rate
7.25%
Create a Home Valuation Report for This Property
The Home Valuation Report is an in-depth analysis detailing your home's value as well as a comparison with similar homes in the area
Home Values in the Area
Average Home Value in this Area
Purchase History
| Date | Buyer | Sale Price | Title Company |
|---|---|---|---|
| Opie Jeffrey R | -- | None Available | |
| Opie Jeffrey R | $937,500 | -- | |
| Zarazinski Paul | $251,000 | Professional National Title | |
| Skarb Jonathan B | $184,500 | -- |
Source: Public Records
Mortgage History
| Date | Status | Borrower | Loan Amount |
|---|---|---|---|
| Previous Owner | Zarazinski Paul | $180,000 | |
| Previous Owner | Skarb Jonathan B | $156,000 |
Source: Public Records
Tax History Compared to Growth
Tax History
| Year | Tax Paid | Tax Assessment Tax Assessment Total Assessment is a certain percentage of the fair market value that is determined by local assessors to be the total taxable value of land and additions on the property. | Land | Improvement |
|---|---|---|---|---|
| 2024 | $18,078 | $61,001 | $18,078 | $42,923 |
| 2023 | $17,198 | $61,001 | $18,078 | $42,923 |
| 2022 | $17,198 | $61,001 | $18,078 | $42,923 |
| 2021 | $18,451 | $56,666 | $8,134 | $48,532 |
| 2020 | $18,036 | $56,666 | $8,134 | $48,532 |
| 2019 | $18,139 | $62,963 | $8,134 | $54,829 |
| 2018 | $20,457 | $63,584 | $7,231 | $56,353 |
| 2017 | $20,100 | $63,584 | $7,231 | $56,353 |
| 2016 | $19,071 | $63,584 | $7,231 | $56,353 |
| 2015 | $18,458 | $57,016 | $6,327 | $50,689 |
| 2014 | $18,207 | $57,016 | $6,327 | $50,689 |
| 2013 | $16,909 | $57,016 | $6,327 | $50,689 |
Source: Public Records
Map
Nearby Homes
- 504 E Sunset Dr
- 2620 N Windsor Dr Unit 201
- 3023 N Windsor Dr
- 1225 Radcliffe Rd Unit 2
- 3157 N Daniels Ct Unit 1502
- 2640 N Windsor Dr Unit 102
- 1306 E Best Dr
- 2604 N Windsor Dr Unit 206
- 215 W Hintz Rd
- 2632 N Windsor Dr Unit 104
- 2522 N Chestnut Ave
- 2315 N Arlington Heights Rd
- 1127 Miller Ln Unit 107
- 972 Thornton Ln Unit 102
- 3222 N Heritage Ln
- 3227 N Heritage Ln
- 1115 Miller Ln Unit 104
- 18 E Heritage Ct
- 3300 N Carriageway Dr Unit 317
- 2608 N Wilshire Ln
- 2728 N Vista Rd
- 2740 N Vista Rd
- 2722 N Vista Rd
- 2804 N Vista Rd
- 2804 N Vista Rd
- 2735 N Vista Rd
- 2731 N Vista Rd
- 2741 N Vista Rd
- 2810 N Vista Rd
- 2710 N Vista Rd
- 2717 N Vista Rd
- 2803 N Vista Rd
- 2727 N Vista Rd
- 2816 N Vista Rd
- 2809 N Douglas Ave
- 506 E Hintz Rd
- 2809 N Vista Rd
- 236 E Kerry Brook Ln
- 233 E Kerry Brook Ln
- 2707 N Vista Rd