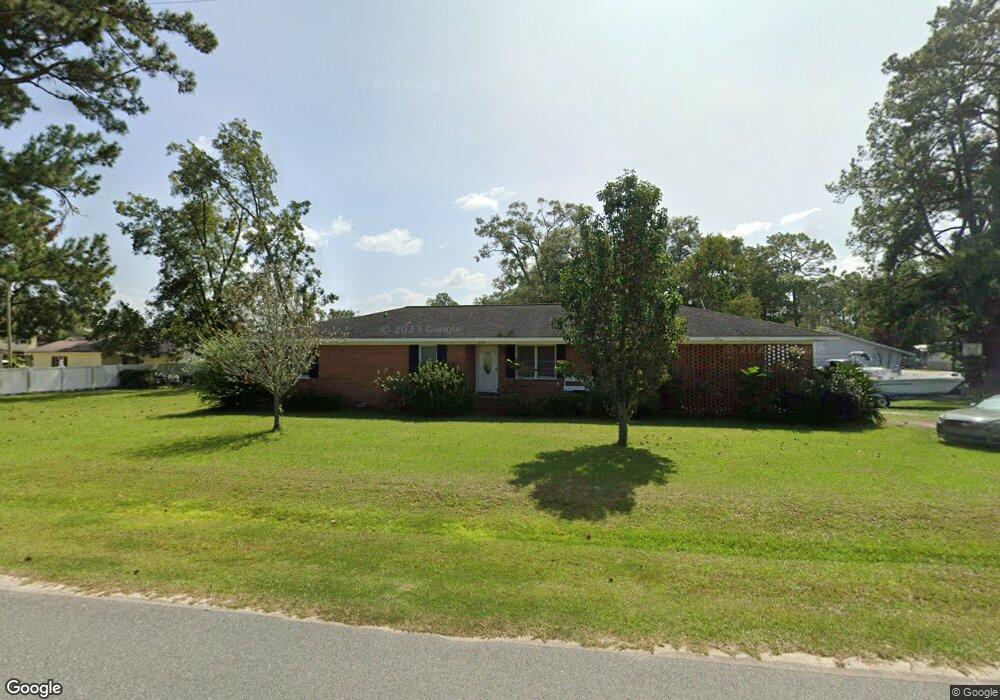
2735 Cherokee St Waycross, GA 31503
Estimated Value: $207,000 - $255,000
4
Beds
3
Baths
1,839
Sq Ft
$122/Sq Ft
Est. Value
About This Home
This home is located at 2735 Cherokee St, Waycross, GA 31503 and is currently estimated at $224,532, approximately $122 per square foot. 2735 Cherokee St is a home located in Ware County with nearby schools including Waresboro Elementary School, Ware County Middle School, and Ware County High School.
Ownership History
Date
Name
Owned For
Owner Type
Purchase Details
Closed on
Dec 16, 2009
Sold by
Chancey Edward L
Bought by
Majors Jarrod L and Majors Laura M
Current Estimated Value
Home Financials for this Owner
Home Financials are based on the most recent Mortgage that was taken out on this home.
Original Mortgage
$115,429
Outstanding Balance
$74,980
Interest Rate
4.82%
Mortgage Type
VA
Estimated Equity
$149,552
Purchase Details
Closed on
Aug 24, 2006
Sold by
Woodard A W
Bought by
Chancey Edward L
Home Financials for this Owner
Home Financials are based on the most recent Mortgage that was taken out on this home.
Original Mortgage
$109,300
Interest Rate
6.67%
Mortgage Type
VA
Purchase Details
Closed on
Dec 23, 1993
Bought by
Woodard A W
Purchase Details
Closed on
Mar 5, 1993
Bought by
Thomas Edward L
Purchase Details
Closed on
Dec 30, 1987
Create a Home Valuation Report for This Property
The Home Valuation Report is an in-depth analysis detailing your home's value as well as a comparison with similar homes in the area
Home Values in the Area
Average Home Value in this Area
Purchase History
| Date | Buyer | Sale Price | Title Company |
|---|---|---|---|
| Majors Jarrod L | $113,000 | -- | |
| Chancey Edward L | $109,300 | -- | |
| Woodard A W | $50,000 | -- | |
| Thomas Edward L | $44,800 | -- | |
| -- | $59,900 | -- |
Source: Public Records
Mortgage History
| Date | Status | Borrower | Loan Amount |
|---|---|---|---|
| Open | Majors Jarrod L | $115,429 | |
| Previous Owner | Chancey Edward L | $109,300 |
Source: Public Records
Tax History Compared to Growth
Tax History
| Year | Tax Paid | Tax Assessment Tax Assessment Total Assessment is a certain percentage of the fair market value that is determined by local assessors to be the total taxable value of land and additions on the property. | Land | Improvement |
|---|---|---|---|---|
| 2024 | $2,013 | $83,138 | $11,340 | $71,798 |
| 2023 | $2,140 | $54,020 | $3,220 | $50,800 |
| 2022 | $1,560 | $54,020 | $3,220 | $50,800 |
| 2021 | $1,423 | $45,364 | $3,220 | $42,144 |
| 2020 | $1,177 | $37,132 | $3,220 | $33,912 |
| 2019 | $1,163 | $35,956 | $3,220 | $32,736 |
| 2018 | $1,387 | $42,514 | $3,220 | $39,294 |
| 2017 | $1,386 | $42,514 | $3,220 | $39,294 |
| 2016 | $1,386 | $42,514 | $3,220 | $39,294 |
| 2015 | $1,399 | $42,514 | $3,220 | $39,294 |
| 2014 | $1,397 | $42,514 | $3,220 | $39,294 |
| 2013 | -- | $42,514 | $3,220 | $39,294 |
Source: Public Records
Map
Nearby Homes
- 2836 Evergreen Rd
- 2857 Cherokee St
- 2867 Evergreen Rd
- 2885 Longwood Rd
- 1238 Red Keen Rd
- 850 Woodard Ln
- 1261 Lake St
- 2117 Tamara Rd
- 1210 N Augusta Ave
- Lot 155 N Augusta Avenue Cherokee Ave
- 2066 Cherokee St
- 1300 Stanton Ave
- 2869 Ben St
- 2879 Ben St
- 2180 Fulford Rd Unit n/a
- 2885 Ben St
- 221 Sierra Ln
- 0 Anita South St
- 1953 State St
- 122 Hopkins St
- 1558 Crestridge Rd
- 1575 Gorman Rd
- 1510 Crestridge Rd
- 1569 Gorman Rd
- 2808 Edgewood Rd
- 2817 Cherokee St
- 1547 Gorman Rd
- 1488 Crestridge Rd
- 0 Red Keen Rd Unit 1651309
- 1505 Gorman Rd
- 2837 Cherokee St
- 2803 Edgewood Rd
- 1489 Gorman Rd
- 1448 Crestridge Rd
- 2819 Edgewood Rd
- 2840 Edgewood Rd
- 2660 Cherokee St
- 1428 Crestridge Rd
- 2847 Cherokee St
- 1429 Gorman Rd