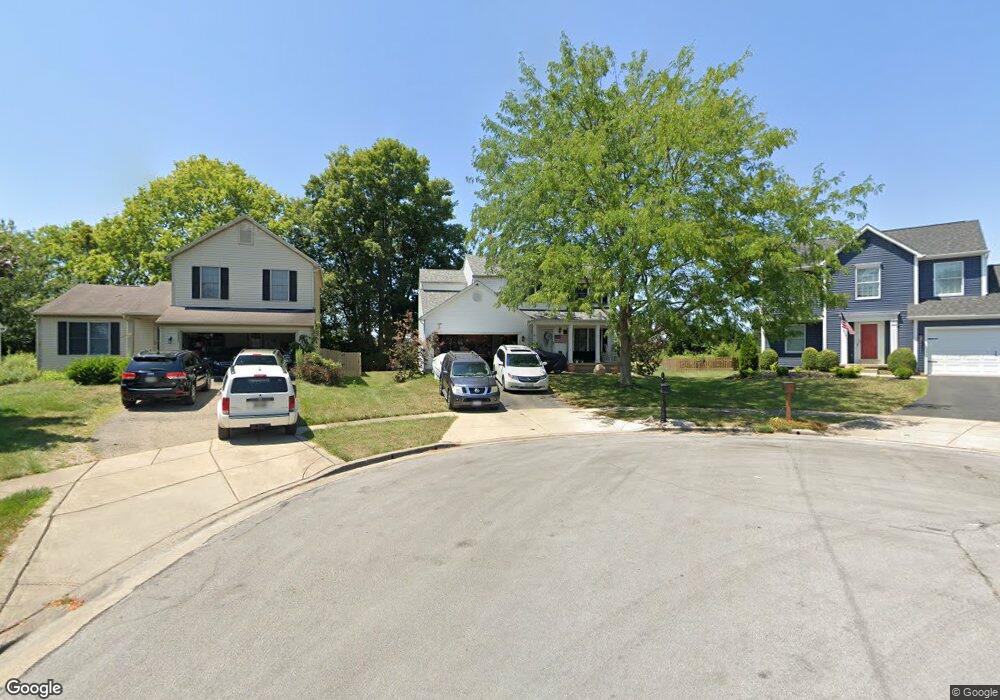
2735 Cross Creek Ave Lancaster, OH 43130
Estimated Value: $284,000 - $330,000
4
Beds
3
Baths
1,660
Sq Ft
$187/Sq Ft
Est. Value
About This Home
This home is located at 2735 Cross Creek Ave, Lancaster, OH 43130 and is currently estimated at $310,401, approximately $186 per square foot. 2735 Cross Creek Ave is a home located in Fairfield County with nearby schools including Tarhe Elementary School, General Sherman Junior High School, and Lancaster High School.
Ownership History
Date
Name
Owned For
Owner Type
Purchase Details
Closed on
Sep 20, 2019
Sold by
C L M Ventures Llc
Bought by
Vavrinak Amy
Current Estimated Value
Home Financials for this Owner
Home Financials are based on the most recent Mortgage that was taken out on this home.
Original Mortgage
$145,000
Interest Rate
3.6%
Mortgage Type
New Conventional
Purchase Details
Closed on
May 19, 2009
Sold by
Secretary Of Housing & Urban Development
Bought by
Clm Ventures Llc
Purchase Details
Closed on
Feb 19, 2009
Sold by
Citimortgage Inc
Bought by
Secretary Of Housing & Urban Development
Purchase Details
Closed on
Feb 5, 2009
Sold by
Yoho Steve L and Case #08 Cv 0379
Bought by
Citimortgage Inc
Purchase Details
Closed on
May 18, 2001
Sold by
Dominion Homes Inc
Bought by
Sprang Sheri L and Yoho Steve L
Home Financials for this Owner
Home Financials are based on the most recent Mortgage that was taken out on this home.
Original Mortgage
$165,239
Interest Rate
7.02%
Mortgage Type
FHA
Create a Home Valuation Report for This Property
The Home Valuation Report is an in-depth analysis detailing your home's value as well as a comparison with similar homes in the area
Home Values in the Area
Average Home Value in this Area
Purchase History
| Date | Buyer | Sale Price | Title Company |
|---|---|---|---|
| Vavrinak Amy | $145,000 | Equity Resources Inc | |
| Clm Ventures Llc | $111,000 | Talon Title | |
| Secretary Of Housing & Urban Development | -- | None Available | |
| Citimortgage Inc | $94,000 | None Available | |
| Sprang Sheri L | $166,575 | -- |
Source: Public Records
Mortgage History
| Date | Status | Borrower | Loan Amount |
|---|---|---|---|
| Previous Owner | Vavrinak Amy | $145,000 | |
| Previous Owner | Sprang Sheri L | $165,239 |
Source: Public Records
Tax History Compared to Growth
Tax History
| Year | Tax Paid | Tax Assessment Tax Assessment Total Assessment is a certain percentage of the fair market value that is determined by local assessors to be the total taxable value of land and additions on the property. | Land | Improvement |
|---|---|---|---|---|
| 2024 | $6,136 | $68,250 | $10,630 | $57,620 |
| 2023 | $2,482 | $68,250 | $10,630 | $57,620 |
| 2022 | $2,492 | $68,250 | $10,630 | $57,620 |
| 2021 | $2,040 | $52,340 | $9,660 | $42,680 |
| 2020 | $1,979 | $52,340 | $9,660 | $42,680 |
| 2019 | $1,906 | $52,340 | $9,660 | $42,680 |
| 2018 | $1,773 | $47,150 | $9,660 | $37,490 |
| 2017 | $1,773 | $46,210 | $8,720 | $37,490 |
| 2016 | $1,728 | $46,210 | $8,720 | $37,490 |
| 2015 | $1,717 | $44,550 | $8,720 | $35,830 |
| 2014 | $1,638 | $44,550 | $8,720 | $35,830 |
| 2013 | $1,638 | $44,550 | $8,720 | $35,830 |
Source: Public Records
Map
Nearby Homes
- 1889 Salt Lick Dr
- 1715 Tecumseh Dr
- 1639 Tecumseh Dr
- 2387 Zachariah Ave
- 2422 Long Bow Ave
- 1638 Quail Meadows Dr
- 2445 Columbus Lancaster Rd NW Unit Lot 176
- 2445 Columbus Lancaster Rd NW Unit Lot 408 Walnut St
- 2445 Columbus Lancaster Rd NW Unit lot 463
- 1632 Bush Hill Dr
- 2195 Olde Ridge Ct
- 3355 Old Columbus Rd NW
- 218 Marvel Dr
- 2610 Misty Meadows Ave
- 260 Scott Dr
- 2482 Brook Run Dr
- 282 14th St
- 1917 Nichole Cir
- 340 16th St
- 331 16th St
- 2737 Cross Creek Ave
- 2733 Cross Creek Ave
- 2741 Cross Creek Ave
- 2731 Cross Creek Ave
- 2745 Cross Creek Ave
- 2745 Cross Creek Ave Lancaster
- 2727 Cross Creek Ave
- 2753 Cross Creek Ave
- 2723 Cross Creek Ave
- 2732 Cross Creek Ave
- 2695 Two Ridge Ave
- 2759 Cross Creek Ave
- 2719 Cross Creek Ave
- 2716 Cross Creek Ave
- 2691 Two Ridge Ave
- 2765 Cross Creek Ave
- 2711 Cross Creek Ave
- 2710 Cross Creek Ave
- 2710 Cross Creek Ave Unit 634
- 2685 Two Ridge Ave