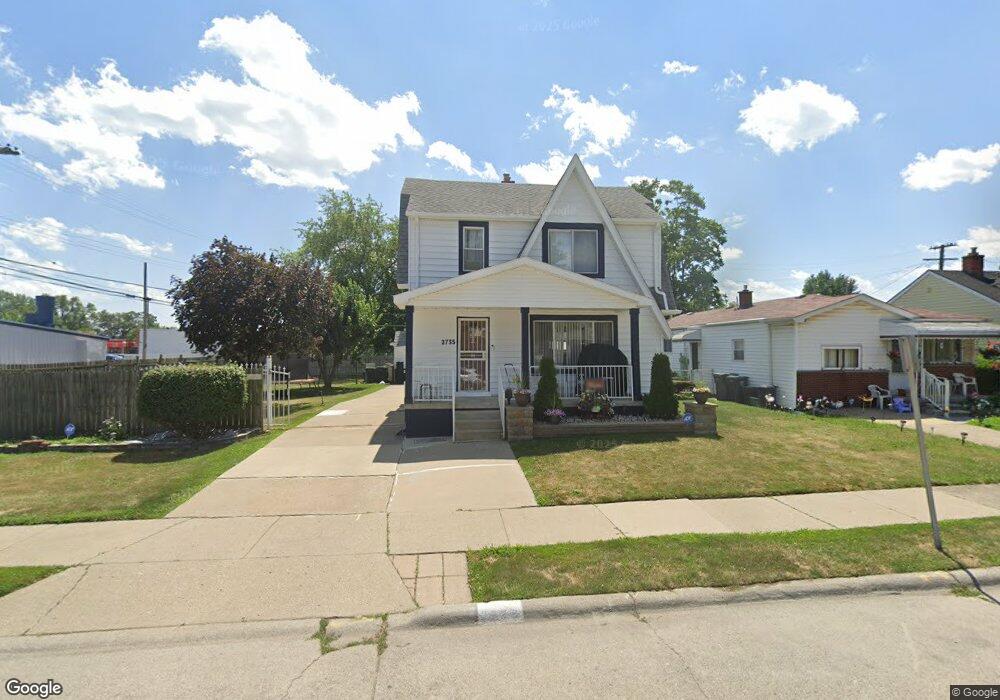
2735 Norman St Melvindale, MI 48122
Estimated Value: $129,000 - $173,000
--
Bed
--
Bath
1,056
Sq Ft
$146/Sq Ft
Est. Value
About This Home
This home is located at 2735 Norman St, Melvindale, MI 48122 and is currently estimated at $153,943, approximately $145 per square foot. 2735 Norman St is a home located in Wayne County with nearby schools including Rogers Early Elementary School, Allendale Elementary School, and Julian O. Strong Middle School.
Ownership History
Date
Name
Owned For
Owner Type
Purchase Details
Closed on
May 3, 2007
Sold by
Kamerschen Jason A and Kamerschen Mindy A
Bought by
Wells Fargo Bank Na and Asset Backed Pass Through Certificates S
Current Estimated Value
Purchase Details
Closed on
Mar 14, 2002
Sold by
Manufacturers & Traders Trust Corp
Bought by
Kamerschen Jason A
Purchase Details
Closed on
Mar 28, 2000
Sold by
Hamilton Bruce
Bought by
Manufacturers & Traders Trust Co
Create a Home Valuation Report for This Property
The Home Valuation Report is an in-depth analysis detailing your home's value as well as a comparison with similar homes in the area
Home Values in the Area
Average Home Value in this Area
Purchase History
| Date | Buyer | Sale Price | Title Company |
|---|---|---|---|
| Wells Fargo Bank Na | $113,484 | None Available | |
| Kamerschen Jason A | $83,000 | First American Title | |
| Manufacturers & Traders Trust Co | $48,440 | -- |
Source: Public Records
Tax History Compared to Growth
Tax History
| Year | Tax Paid | Tax Assessment Tax Assessment Total Assessment is a certain percentage of the fair market value that is determined by local assessors to be the total taxable value of land and additions on the property. | Land | Improvement |
|---|---|---|---|---|
| 2025 | $1,212 | $70,500 | $0 | $0 |
| 2024 | $1,212 | $60,700 | $0 | $0 |
| 2023 | $1,155 | $53,900 | $0 | $0 |
| 2022 | $2,244 | $48,300 | $0 | $0 |
| 2021 | $2,175 | $43,500 | $0 | $0 |
| 2020 | $2,167 | $35,400 | $0 | $0 |
| 2019 | $2,009 | $31,800 | $0 | $0 |
| 2018 | $1,198 | $32,126 | $0 | $0 |
| 2017 | $1,311 | $32,700 | $0 | $0 |
| 2016 | $1,940 | $31,000 | $0 | $0 |
| 2015 | $2,814 | $28,300 | $0 | $0 |
| 2013 | $2,750 | $28,900 | $0 | $0 |
| 2012 | $1,196 | $28,100 | $2,900 | $25,200 |
Source: Public Records
Map
Nearby Homes