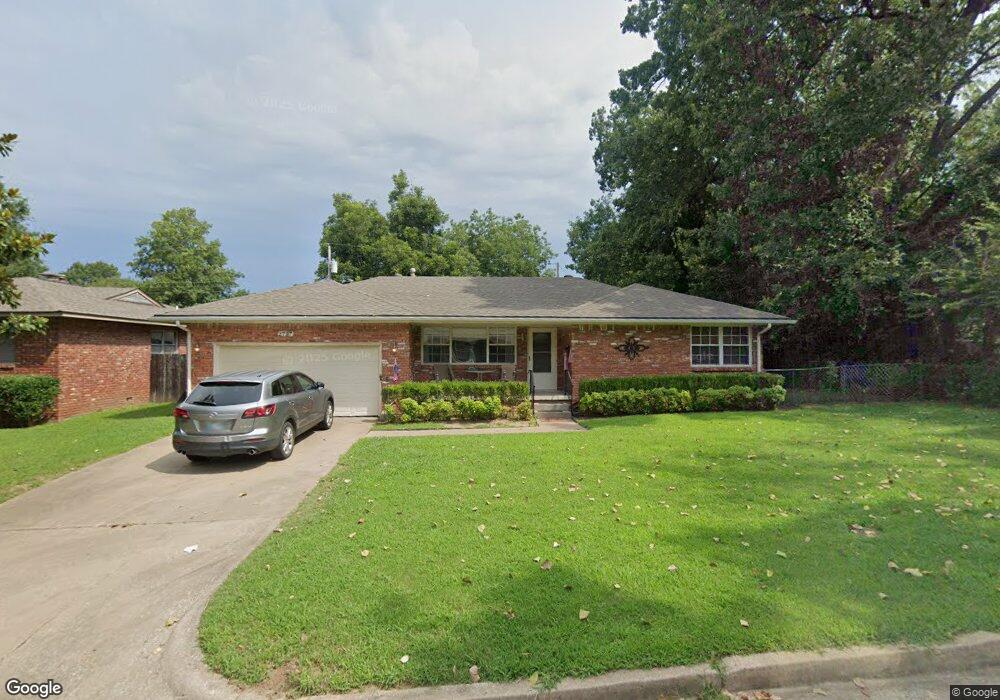
2737 E 56th St Tulsa, OK 74105
South Peoria NeighborhoodEstimated Value: $209,608 - $224,000
3
Beds
2
Baths
1,352
Sq Ft
$162/Sq Ft
Est. Value
About This Home
This home is located at 2737 E 56th St, Tulsa, OK 74105 and is currently estimated at $218,902, approximately $161 per square foot. 2737 E 56th St is a home located in Tulsa County with nearby schools including Carnegie Elementary School, Memorial Middle School, and Memorial High School.
Ownership History
Date
Name
Owned For
Owner Type
Purchase Details
Closed on
Dec 28, 2017
Sold by
Lynn O Donnell Mitchell S and Donnell Traci Lynn O
Bought by
Sellbuy Proerties Llc
Current Estimated Value
Purchase Details
Closed on
Oct 28, 2013
Sold by
Odonnell Mitchell Shan and Odonnell Traci
Bought by
Soto Property Investors Llc and Sellbuy Properties Llc
Purchase Details
Closed on
Feb 4, 2013
Sold by
Odonnell Shan and Odonnell Mitchell
Bought by
Odonnell Mitchell and Odonnell Traci
Home Financials for this Owner
Home Financials are based on the most recent Mortgage that was taken out on this home.
Original Mortgage
$81,851
Interest Rate
3.39%
Mortgage Type
New Conventional
Purchase Details
Closed on
Jun 23, 2005
Sold by
Alonso Anthony and Alonso Theresa
Bought by
Odonnell Shan
Home Financials for this Owner
Home Financials are based on the most recent Mortgage that was taken out on this home.
Original Mortgage
$74,400
Interest Rate
5.63%
Mortgage Type
Fannie Mae Freddie Mac
Create a Home Valuation Report for This Property
The Home Valuation Report is an in-depth analysis detailing your home's value as well as a comparison with similar homes in the area
Home Values in the Area
Average Home Value in this Area
Purchase History
| Date | Buyer | Sale Price | Title Company |
|---|---|---|---|
| Sellbuy Proerties Llc | -- | None Available | |
| Soto Property Investors Llc | -- | None Available | |
| Odonnell Mitchell | -- | None Available | |
| Odonnell Shan | $93,000 | The Executives Title & Escro |
Source: Public Records
Mortgage History
| Date | Status | Borrower | Loan Amount |
|---|---|---|---|
| Previous Owner | Odonnell Mitchell | $81,851 | |
| Previous Owner | Odonnell Shan | $74,400 |
Source: Public Records
Tax History
| Year | Tax Paid | Tax Assessment Tax Assessment Total Assessment is a certain percentage of the fair market value that is determined by local assessors to be the total taxable value of land and additions on the property. | Land | Improvement |
|---|---|---|---|---|
| 2025 | $1,966 | $14,672 | $3,043 | $11,629 |
| 2024 | $1,689 | $13,974 | $3,347 | $10,627 |
| 2023 | $1,689 | $13,308 | $2,829 | $10,479 |
| 2022 | $1,690 | $12,675 | $4,043 | $8,632 |
| 2021 | $1,594 | $12,071 | $3,850 | $8,221 |
| 2020 | $1,572 | $12,071 | $3,850 | $8,221 |
| 2019 | $1,693 | $12,357 | $4,136 | $8,221 |
| 2018 | $1,697 | $12,357 | $4,136 | $8,221 |
| 2017 | $1,694 | $12,357 | $4,136 | $8,221 |
| 2016 | $1,610 | $11,989 | $4,013 | $7,976 |
| 2015 | $1,536 | $11,418 | $4,136 | $7,282 |
| 2014 | $1,521 | $11,418 | $4,136 | $7,282 |
Source: Public Records
Map
Nearby Homes
- 5534 S Columbia Ave
- 5644 S Delaware Ave
- 2601 E 57th St
- 2706 E 57th St
- 5519 S Atlanta Ave Unit 24
- 2528 E 57th St
- 5127 S Columbia Ave
- 5120 S Columbia Ct
- 2615 E 59th St
- 5819 S Delaware Place
- 2926 E 57th Place
- 5206 S Harvard Ave Unit 111
- 5206 S Harvard Ave Unit 106
- 6013 S Atlanta Ave Unit 2
- 5922 S Atlanta Place Unit 2
- 2709 E 61st St
- 2202 E 55th Ct Unit 2202`
- 4929 S Columbia Ave
- 4905 S Columbia Ave
- 3718 E 56th St
- 2729 E 56th St
- 2748 E 55th Place
- 2740 E 55th Place
- 5552 S Delaware Ct
- 5546 S Delaware Ct
- 2732 E 55th Place
- 2727 E 56th St
- 2742 E 56th St
- 5556 S Delaware Ct
- 5540 S Delaware Ct
- 2728 E 55th Place
- 2721 E 56th St
- 5557 S Delaware Ct
- 5607 S Columbia Place
- 2728 E 56th St
- 5534 S Delaware Ct
- 5519 S Columbia Ct
- 2722 E 55th Place
- 2735 E 55th Place
- 2717 E 56th St
Your Personal Tour Guide
Ask me questions while you tour the home.