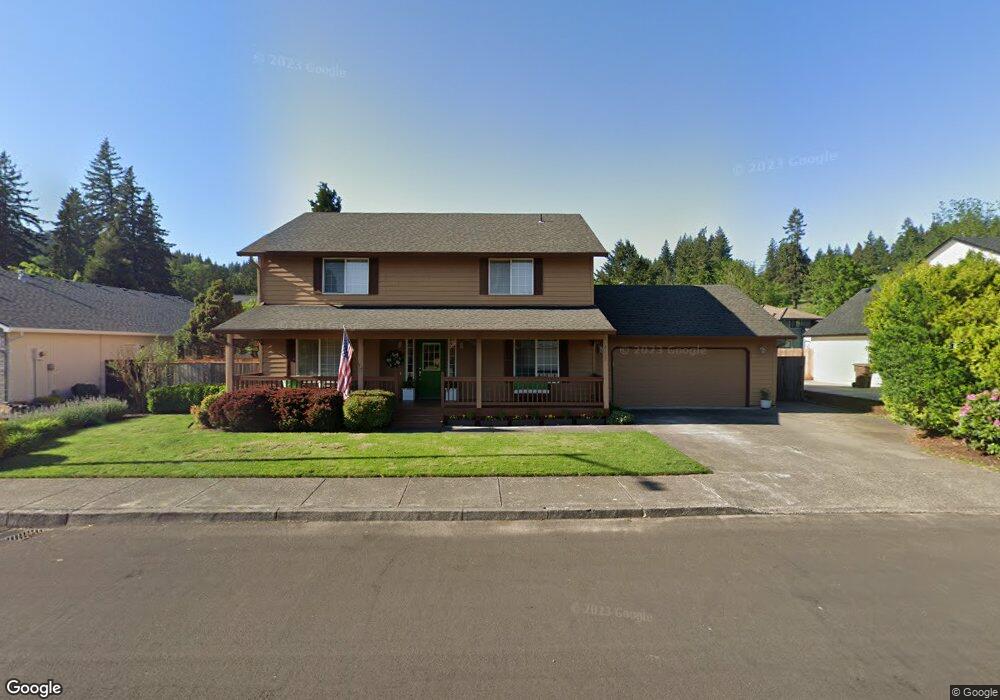
2737 N O St Washougal, WA 98671
Estimated Value: $559,000 - $618,000
4
Beds
3
Baths
2,106
Sq Ft
$275/Sq Ft
Est. Value
About This Home
This home is located at 2737 N O St, Washougal, WA 98671 and is currently estimated at $579,152, approximately $275 per square foot. 2737 N O St is a home located in Clark County with nearby schools including Hathaway Elementary School, Jemtegaard Middle School, and Washougal High School.
Ownership History
Date
Name
Owned For
Owner Type
Purchase Details
Closed on
Oct 31, 2024
Sold by
Meany Edward and Meany Lisa Marie
Bought by
Makarios Revocable Trust and Meany
Current Estimated Value
Purchase Details
Closed on
Mar 22, 2005
Sold by
Habkirk James B and Habkirk Vanessa A
Bought by
Meany Edward and Meany Lisa Marie
Home Financials for this Owner
Home Financials are based on the most recent Mortgage that was taken out on this home.
Original Mortgage
$184,800
Interest Rate
5.37%
Mortgage Type
Purchase Money Mortgage
Purchase Details
Closed on
Jan 3, 1997
Sold by
Tur Usa Inc
Bought by
Habkirk Jim B and Williams Vanessa A
Home Financials for this Owner
Home Financials are based on the most recent Mortgage that was taken out on this home.
Original Mortgage
$131,350
Interest Rate
7.53%
Mortgage Type
Balloon
Create a Home Valuation Report for This Property
The Home Valuation Report is an in-depth analysis detailing your home's value as well as a comparison with similar homes in the area
Home Values in the Area
Average Home Value in this Area
Purchase History
| Date | Buyer | Sale Price | Title Company |
|---|---|---|---|
| Makarios Revocable Trust | $313 | None Listed On Document | |
| Meany Edward | $231,000 | Clark County Title | |
| Habkirk Jim B | $39,900 | Chicago Title Insurance Co |
Source: Public Records
Mortgage History
| Date | Status | Borrower | Loan Amount |
|---|---|---|---|
| Previous Owner | Meany Edward | $184,800 | |
| Previous Owner | Habkirk Jim B | $131,350 |
Source: Public Records
Tax History Compared to Growth
Tax History
| Year | Tax Paid | Tax Assessment Tax Assessment Total Assessment is a certain percentage of the fair market value that is determined by local assessors to be the total taxable value of land and additions on the property. | Land | Improvement |
|---|---|---|---|---|
| 2025 | $4,597 | $463,036 | $130,000 | $333,036 |
| 2024 | $4,398 | $484,511 | $169,000 | $315,511 |
| 2023 | $4,559 | $485,089 | $171,600 | $313,489 |
| 2022 | $4,536 | $492,488 | $174,200 | $318,288 |
| 2021 | $4,436 | $425,241 | $149,500 | $275,741 |
| 2020 | $4,015 | $390,203 | $136,500 | $253,703 |
| 2019 | $3,594 | $358,744 | $130,000 | $228,744 |
| 2018 | $3,882 | $339,523 | $0 | $0 |
| 2017 | $3,371 | $302,675 | $0 | $0 |
| 2016 | $3,265 | $288,734 | $0 | $0 |
| 2015 | $3,154 | $255,675 | $0 | $0 |
| 2014 | -- | $245,736 | $0 | $0 |
| 2013 | -- | $217,339 | $0 | $0 |
Source: Public Records
Map
Nearby Homes