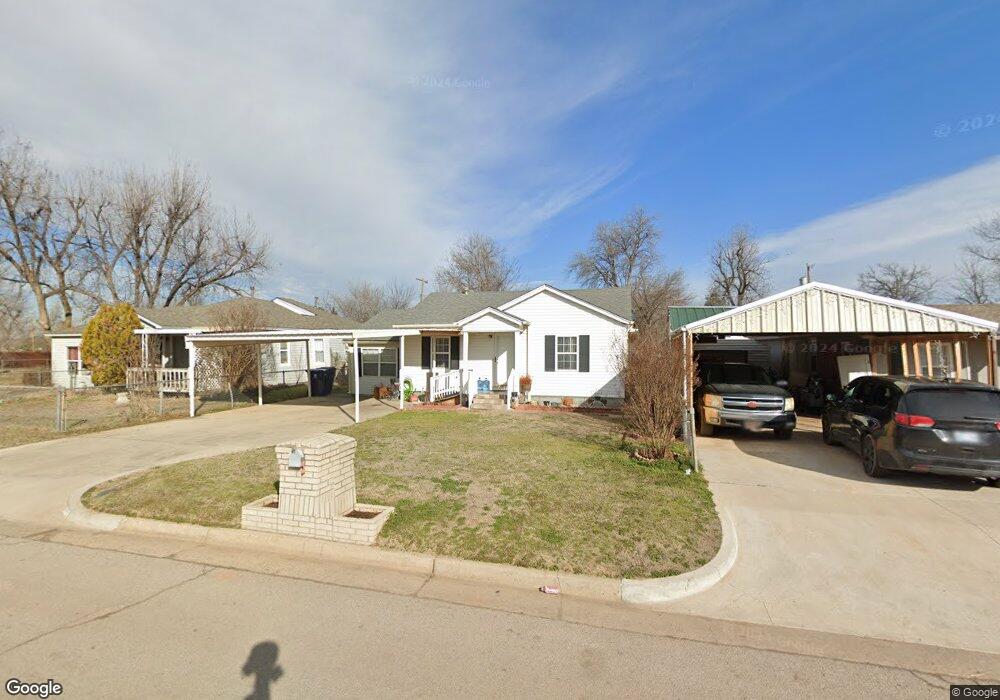
2737 SW 34th St Oklahoma City, OK 73119
Jackson NeighborhoodEstimated Value: $132,000 - $155,000
2
Beds
2
Baths
1,116
Sq Ft
$128/Sq Ft
Est. Value
About This Home
This home is located at 2737 SW 34th St, Oklahoma City, OK 73119 and is currently estimated at $142,885, approximately $128 per square foot. 2737 SW 34th St is a home located in Oklahoma County with nearby schools including Rockwood Elementary School, Mary Golda Ross Middle School, and Northwest Classen High School.
Ownership History
Date
Name
Owned For
Owner Type
Purchase Details
Closed on
Nov 16, 2022
Sold by
Martinez Juana and Martinez Idania
Bought by
Muniz Idania and Davalos Fernanda F
Current Estimated Value
Purchase Details
Closed on
Aug 6, 2007
Sold by
Deutsche Bank National Trust Co
Bought by
Martinez Juana and Davalos Idania Muniz
Purchase Details
Closed on
Jun 27, 2007
Sold by
Unsell Bernice J and Jo Lee Inc
Bought by
Deutsche Bank National Trust Co and Long Beach Mortgage Loan Trust 2005-Wl3
Purchase Details
Closed on
Jul 29, 2005
Sold by
Jo Lee Inc
Bought by
Unsell Bernice J
Home Financials for this Owner
Home Financials are based on the most recent Mortgage that was taken out on this home.
Original Mortgage
$55,250
Interest Rate
10.15%
Mortgage Type
Purchase Money Mortgage
Purchase Details
Closed on
Oct 20, 2003
Sold by
Delong Karen J
Bought by
Jo Lee Inc
Purchase Details
Closed on
Oct 9, 2003
Sold by
Lee Richard A
Bought by
Delong Karen
Create a Home Valuation Report for This Property
The Home Valuation Report is an in-depth analysis detailing your home's value as well as a comparison with similar homes in the area
Home Values in the Area
Average Home Value in this Area
Purchase History
| Date | Buyer | Sale Price | Title Company |
|---|---|---|---|
| Muniz Idania | -- | -- | |
| Martinez Juana | $29,500 | First American Title & Tr Co | |
| Deutsche Bank National Trust Co | -- | None Available | |
| Unsell Bernice J | $65,000 | Capitol Abstract & Title Co | |
| Jo Lee Inc | -- | -- | |
| Delong Karen | -- | -- |
Source: Public Records
Mortgage History
| Date | Status | Borrower | Loan Amount |
|---|---|---|---|
| Previous Owner | Unsell Bernice J | $55,250 |
Source: Public Records
Tax History Compared to Growth
Tax History
| Year | Tax Paid | Tax Assessment Tax Assessment Total Assessment is a certain percentage of the fair market value that is determined by local assessors to be the total taxable value of land and additions on the property. | Land | Improvement |
|---|---|---|---|---|
| 2024 | $1,224 | $10,860 | $635 | $10,225 |
| 2023 | $1,224 | $10,342 | $645 | $9,697 |
| 2022 | $997 | $9,850 | $722 | $9,128 |
| 2021 | $944 | $9,403 | $604 | $8,799 |
| 2020 | $921 | $9,130 | $723 | $8,407 |
| 2019 | $934 | $9,277 | $718 | $8,559 |
| 2018 | $907 | $9,007 | $0 | $0 |
| 2017 | $876 | $8,744 | $1,085 | $7,659 |
| 2016 | $889 | $8,854 | $1,085 | $7,769 |
| 2015 | $913 | $8,993 | $1,085 | $7,908 |
| 2014 | $895 | $8,876 | $1,085 | $7,791 |
Source: Public Records
Map
Nearby Homes
- 2819 SW 33rd St
- 2815 SW 32nd St
- 2824 SW 31st St
- 2539 SW 32nd St
- 2504 SW 35th St
- 2912 SW 39th Terrace
- 2644 SW 40th St
- 2850 SW 40th St
- 3013 SW 40th Place
- 3928 S Agnew Place
- 4200 SW 29th St
- 4021 S Drexel Ave
- 2304 SW Binkley St
- 2625 SW 43rd St
- 2617 SW 43rd St
- 3916 S Youngs Place
- 3001 SW 26th St
- 3325 S Independence Ave
- 3616 S Parkview Ave
- 2141 SW 35th St
- 2741 SW 34th St
- 2733 SW 34th St
- 2745 SW 34th St
- 2729 SW 34th St
- 2725 SW 34th St
- 2736 SW 33rd St
- 2732 SW 33rd St
- 2740 SW 33rd St
- 2728 SW 33rd St
- 3400 S Ross Ave
- 2721 SW 34th St
- 2736 SW 34th St
- 2740 SW 34th St
- 2732 SW 34th St
- 2801 SW 34th St
- 2724 SW 33rd St
- 2744 SW 34th St
- 2728 SW 34th St
- 2717 SW 34th St
- 2724 SW 34th St